

Market Strategy
by Talley Leger, Chief Market Strategist
September 4, 2026
Equity Valuation: A Compass, not a Stopwatch
Ordinary Least Squares (OLS) is a common statistical method used to estimate the unknown parameters in a linear regression model. Its core objective is to calculate a “best fit” straight line through a set of data points by minimizing the Sum of the Squared Residuals (SSR) or differences between the observed data and the estimated regression line. In the classroom, textbook OLS regression assumes that error terms are independent, uncorrelated and identically distributed “white noise.”
In real-time financial markets, however, asset prices don’t immediately reset to their “intrinsic” value. Rather, stocks experience multi-year regimes shaped by a host of powerful forces, including price momentum, positioning, investor sentiment, liquidity and regulation. If the S&P 500 trades at a premium to fair value this period (), technical and fundamental tailwinds make it statistically probable for the index to stay at a premium next period (), forming long-term valuation waves or cycles (see the chart below).
A Feature, not a Bug
A couple of weeks ago, I estimated the “fair” value of the S&P 500 using a simple bivariate regression model based on the natural logarithms of: 1) Moody’s seasoned 20-year Baa corporate bond yield; and 2) S&P 500 trailing 12-month operating earnings per share (EPS).
Empirically, we observe persistent, multi-year swings in the error term of my “intrinsic” valuation model, which is a classic sign of auto correlation. Serial correlation occurs when the error term at time () is strongly correlated with previous error terms (). Rather than looking like a “random walk,” the error term traces smooth, low-frequency waves around its mean of zero because positive (negative) residuals tend to follow positive (negative) residuals (see the chart below).
Equity Valuation Residuals Don’t Scatter; They Wave or Cycle
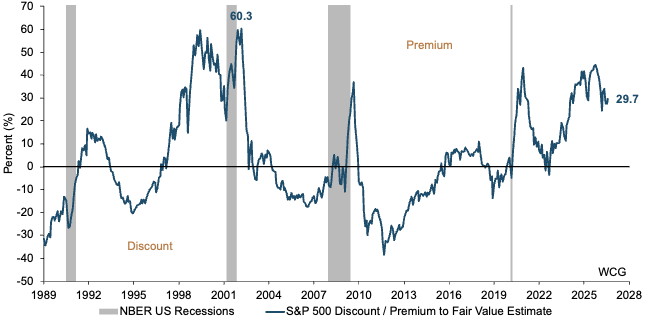
Sources: FRED, Moody’s, S&P Global, WCG, 08/24/26. Notes: NBER = National Bureau of Economic Research.
From a strict, pure econometric standpoint, autocorrelation violates classical Gauss-Markov assumptions. While earnings (t-statistic = 32.57) and interest rates (t-statistic = -3.11) remain highly significant and intuitive determinants of share prices, regressions of trending variables – albeit “normalized” – can understate or deflate coefficient standard errors (SE).
From a practical market strategy perspective, persistent oscillation of an error term is a feature, not a bug of a working valuation model. If the residual were “white noise,” the stock market would have no valuation waves or cycles. In other words, serial correlation creates a measurable pattern of valuation risk: Premiums (+2 SE) and discounts (-2 SE) can endure – and even compound – before eventually reverting toward their mean.
False Precision
The historical symmetry and rhythm of the error term in my model is seductive: At a casual glance, it looks like the ultimate “buy low, sell high” cheat code. Specifically, it correctly identified the deep -40% washout following the “Global Financial Crisis” and “Great Recession” of 2008-2009, the epic +60% valuation bubble of the “dot.com” era, as well as the severe -30% discount of the early-1990s recession.
Misinterpreting such “fair” valuation models as tactical trading signals (i.e., hard, mechanical triggers to either raise cash positions or short stocks) is where even the more experienced practitioners can get carried out of the game on stretchers. Rather, my model should be used as a gauge of the prospective risk/reward embedded in share prices, not as a short-term timing tool.
The “Irrational Exuberance” Trap
The biggest vulnerability of fundamental “mean-reversion” models is the timeframe mismatch. Arguably, fundamentals shape stock market returns over longer time horizons, whereas technicals influence returns over shorter ones (e.g., intra-day).
- Being Early = Being Wrong: Imagine using a strict “sell” signal of +30%, an overvalued threshold that the S&P 500 crossed in early 1998. If an equity trader shorted or liquidated their portfolio at that time, they would have sat in cash while the stock market rose another 36% over the next two years!
- “Sticky” Residual: Valuation requires a catalyst or a change agent. Extreme premiums (discounts) tend to breed even more extreme premiums (discounts) before the fever finally breaks because the residual is “sticky” or autocorrelated.
Use With Caution
In my humble opinion, it’s appropriate to invest in stocks for the long run, although some operating conditions may be better than others. While my model fails in a day-trading environment, for example, it can be a useful Strategic Asset Allocation (SAA) tool. Instead of binary buy/sell decisions, institutional allocators use oscillators like this one to dynamically tilt portfolios:
- Scaling Beta (0% Zone): When the oscillator sits near 0% or “fair” value, investors might choose to hold a neutral, benchmark allocation to US large market capitalization equities.
- Harvesting Risk (+30% Zone): When the premium crosses +30%, don’t panic-sell. Instead of committing new capital to US large cap-weighted indices, consider rebalancing by trimming high-velocity winners (e.g., semiconductors) and rotating into lagging segments (e.g., software), equally-weighted or smaller-cap indices, high-quality and low-volatility factors, income, international, etc.
- Deploying Cash (-20% Zone): When the oscillator plunges into the discount zone, it gives disciplined, contrarian investors the quantitative courage to buy when they may not want to. That’s when we tell advisors and their clients to deploy excess cash and overweight US large-cap stocks in globally-diversified portfolios.
Market Strategy Flash, S&P 500: The Tug of War Between Earnings & Interest Rates, August 21, 2026
Portfolio Strategy
by Jim Worden, CFA®, CMT®, CAIA®, Chief Investment Officer
September 4, 2026
Wading through Volatility
We are two-thirds through the year. The S&P 500 is up 13.12% through the end of August. On average, when the market is up this much through August, the S&P 500 gains an extra 7.12% in the last four months of the year1. Since the GFC, when the market is up more than 13%, we see an average return of 9.06% for the last four months2.
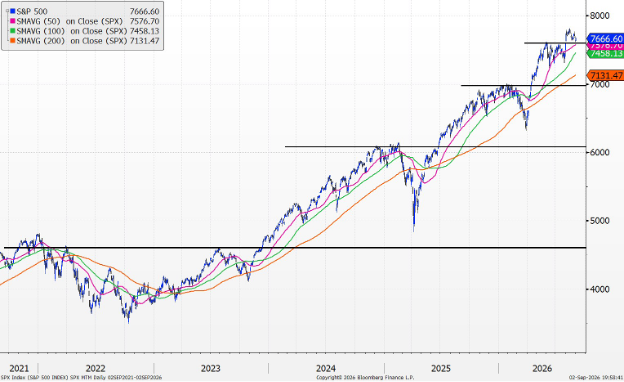
Here’s a price return of the S&P 500 from 9/2/21 through 9/2/26. Thus far, the market has climbed the wall of worry, breaking above resistance to move higher. Resistance becomes support and allows the market some breathing room to consolidate before potentially climbing again. It’s helpful to remember that markets can correct through price or they can correct through time. As investors, we would prefer that they correct through time.
We must now navigate September and October, two months that often have the highest volatility3. If we can make it relatively unscathed through September and October, November and December are some of the best months to be invested4. When we look at the VIX index, which looks at implied volatility for the next 30 days, three of the highest volatility months on average are August, September, and October5. Conversely, volatility, as measured by the VIX, is lowest in November6.
Speaking of volatility, every now and then a product comes along that is indirectly investing in volatility, going either long or short. These convexity products come around every so often. The pitch is that they can either protect on the downside or they can provide high income by being short volatility. Some of these may be legitimate trading strategies but may be marketed towards normal investors. And some strategies may be marketed as an income-producing asset. If a strategy acts like a fixed-income or normal bond strategy but has a very high yield and is tied to vega or volatility option writing or swap agreements, caveat emptor. These can behave like bonds and then, during bad times, behave like volatile stocks. These products or strategies may look alluring in a good market environment, but should give investors pause.
Footnotes
- According to Bloomberg data, S&P 500 total returns from 1928 through 2025, looking at January through August data (21.01%) compared to January through December of each year (28.13%), not including 2026 data.
- According to Bloomberg data, S&P 500 total returns from 2009 through 2025, looking at January through August data (17.54%) compared to January through December of each year (26.60%), not including 2026 data.
- According to Bloomberg data, S&P 500 standard deviation of total returns by month from 1928 through 2025. September and October have average volatility of 20.28% (ranked 9th out of 12) and 20.8% (ranked 11th out of 12), respectively.
- According to Bloomberg data, S&P 500 total returns from 1928 through 2025, November returns rank 6th best (1.17%) and December returns rank first (1.93%).
- According to Bloomberg, VIX index average monthly percentage changes from 1997 through 2026 YTD were 9.13%, 8.37%, and 4.88%, respectively, for August, September, and October.
- According to Bloomberg data, the VIX Index average monthly percentage change from 1997 to 2026 YTD was -6.71% for November. The next closest negative month was March at -3.18%.
Definitions
S&P 500: A stock market index tracking the performance of 500 of the largest publicly traded companies in the United States. It serves as a primary benchmark for the overall health of the U.S. stock market.
Operating EPS: A company’s net profit from regular business operations divided by its outstanding shares, excluding one-time gains or losses. It shows how much profit a company generates from its core everyday business.
P/E: A financial metric calculated by dividing a company’s current stock price by its EPS. It shows how much investors are willing to pay for every dollar of the company’s profit.
NBER Recession: A significant decline in economic activity spread across the economy, lasting more than a few months, as officially designated by the National Bureau of Economic Research. It is determined by analyzing factors like gross domestic product, income and employment.
Moody’s Seasoned -Year Baa Corporate Bond Yield: The average interest rate paid on corporate bonds with a 20-year maturity that are rated Baa, which represents medium-grade investment bonds with moderate credit risk. It serves as a key benchmark for corporate borrowing costs.
Natural Logarithm: A mathematical function that determines the exponent to which the constant e (approximately 2.718) must be raised to equal a given number. It is widely used in finance and science to model continuous growth rates.
Standard Error: A statistical metric that measures how much a sample mean is expected to deviate from the true population mean. A lower standard error indicates that the sample data provides a more accurate estimate of the whole population.
R-Square (Coefficient of Determination): A statistical measure that indicates the percentage of variance in a dependent variable that can be explained by an independent variable in a regression model. It ranges from 0 to 1, where higher values show a stronger fit between the data and the model.
Gauss-Markov Theorem: It states that in a linear regression model where the errors have an expected value of zero, are uncorrelated, and have equal variance, the Ordinary Least Squares (OLS) estimator is the Best Linear Unbiased Estimator (BLUE). This means that among all linear, unbiased estimators, the OLS estimator achieves the lowest possible variance for the regression coefficients.
S&P 500 Index: A market-capitalization-weighted index of 500 leading U.S. companies and a widely used measure of U.S. large-cap equity market performance.
VIX Index: The Cboe Volatility Index, which measures the market’s expectation of 30-day forward-looking volatility using S&P 500 Index option prices.
Volatility: The degree of variation in the price or return of an investment over time. Higher volatility generally indicates larger price swings.
Standard deviation: A statistical measure of the dispersion of returns around their average and a commonly used measure of volatility.
Price return: The change in the price of an investment or index, excluding dividends or other distributions.
Total return: The change in price plus dividends or other distributions, assuming reinvestment.
Support: A price level at which buying interest may emerge and potentially slow or stop a decline.
Resistance: A price level at which selling interest may emerge and potentially slow or stop an advance.
Vega: A measure of an option’s sensitivity to a change in implied volatility.
Option writing: The sale of option contracts, which creates contractual obligations for the option seller if the option is exercised.
Swap agreement: A derivative contract in which counterparties agree to exchange cash flows based on specified terms or underlying market variables.
Convexity: The nonlinear relationship between changes in an underlying market factor and changes in the value or behavior of an investment or strategy.
GFC: Global Financial Crisis, generally referring to the 2007–2009 financial crisis.
Disclosures
This material is provided for informational and educational purposes only and is not intended as investment advice, a recommendation, or an offer or solicitation to buy or sell any security or investment strategy.
Investing involves risk, including the possible loss of principal. Past performance is not indicative of future results. Historical averages, seasonal patterns, and prior market behavior do not guarantee or predict future performance.
Index performance is unmanaged, does not reflect fees, expenses, taxes, or transaction costs, and investors cannot invest directly in an index.
Market and index data are sourced from Bloomberg and are believed to be reliable; however, their accuracy or completeness is not guaranteed and the data have not necessarily been independently verified.
Technical analysis, including references to support and resistance, is subjective and does not assure that any price level will hold or that historical patterns will repeat.
Options, swaps, volatility-linked investments, and other derivative or volatility-based strategies involve additional risks, which may include leverage, liquidity, counterparty, pricing, and volatility risk, and may result in substantial losses.
The views expressed are for informational and educational purposes only and are subject to change without notice.
This material is not intended as, and should not be interpreted as, individualized investment advice or a recommendation to buy, sell, or hold any security, sector, industry, or investment strategy.
References to specific companies, securities, sectors, or industries are for illustrative purposes only and should not be construed as investment recommendations.
Investing involves risk, including the possible loss of principal. Investments in a specific industry or sector may involve greater risk and volatility than more diversified investments.
Past performance is not indicative of future results. No investment strategy can guarantee a profit or protect against loss.
Forward-looking statements, including views about future demand, pricing, supply, or industry cycles, are based on current expectations and assumptions and are subject to risks and uncertainties. Actual results may differ materially.
Data and information are believed to be reliable, but accuracy, completeness, and timeliness are not guaranteed. Source documents should be retained for factual claims, third-party research references, and company-specific data.
Portfolio holdings, allocations, and risk budgets are subject to change based on market conditions, client objectives, and investment guidelines.
The author, firm, clients, or related persons may hold positions in securities mentioned and may buy or sell those securities without notice, subject to applicable policies and regulations.
Securities offered through LPL Financial, Member FINRA/SIPC. Investment Advice offered through WCG Wealth Advisors, LLC, an SEC Registered Investment Advisor. WCG Wealth Advisors, LLC and The Wealth Consulting Group are separate entities from LPL Financial. Index performance is shown for illustrative purposes only and does not predict or depict the performance of any investment. Past performance does not guarantee future results.
All information in this report is believed to be from reliable sources; however, WCG Wealth Advisors, LLC, makes no representation as to its completeness or accuracy.
In general, stock values fluctuate, sometimes widely, in response to activities specific to the companies as well as broad market, economic and political conditions. Stock investing involves risks, including fluctuating prices and loss of principal. Value investments can perform differently from the market as a whole. They can remain undervalued by the market for long periods of time. (135-LPL) International investing involves special risks such as currency fluctuation and political instability and may not be suitable for all investors. These risks are often heightened for investments in emerging markets. (93-LPL)
The fast price swings in commodities will result in significant volatility in an investor’s holdings. Commodities include increased risks, such as political, economic, and currency instability, and may not be suitable for all investors. (122-LPL)
Rebalancing a portfolio may cause investors to incur tax liabilities and/or transaction costs and does not assure a profit or protect against a loss. (28-LPL)
There is no guarantee that a diversified portfolio will enhance overall returns or outperform a non-diversified portfolio. Diversification does not protect against market risk. (26-LPL)
Standard deviation is a historical measure of the variability of returns relative to the average annual return. If a portfolio has a high standard deviation, its returns have been volatile. A low standard deviation indicates returns have been less volatile. (131-LPL)
This is for educational / general purposes only, does not constitute investment, tax or legal advice and should not be relied on as such. This is not to be construed as an offer to buy or sell any financial instruments. Any strategies discussed are not intended to be relied upon as the sole factor in making an investment decision for any individual. As with all investments there are associated inherent risks. Please obtain and review all financial material carefully before investing. All material presented is compiled from sources believed to be reliable and current, but accuracy cannot be guaranteed. The opinions voiced in this material are for general information only and are not intended to provide specific advice or recommendations for any individual. All performance referenced is historical and is no guarantee of future results. All indices are unmanaged and may not be invested in directly. These comments should not be construed as recommendations but as an illustration of broader themes.
Forward-looking statements are not guarantees of future results. They involve risks, uncertainties and assumptions; there can be no assurance that actual results will not differ materially from expectations. In addition, forward-looking statements, including index targets or market scenarios, are hypothetical in nature, reflect current views and assumptions and are subject to change based on market and economic conditions and are not guarantees of future performance. This is a hypothetical example and is not representative of any specific investment. Your results may vary. (88-LPL) Scenario outcomes are illustrative and not predictive. This does not constitute a recommendation of any investment strategy or product for a particular investor. Investors should consult a financial professional before making any investment decisions.
The S&P 500 is a stock market index tracking the stock performance of 500 of the largest companies listed on stock exchanges in the United States. Indexes are unmanaged and cannot be invested in directly. (102-LPL)
Government bonds and Treasury bills are guaranteed by the US government as to the timely payment of principal and interest and, if held to maturity, offer a fixed rate of return and fixed principal value.
Publication Date: September 4, 2026
For Public Use in the US
The Wealth Consulting Group
LPL 1170488