
Market Strategy
by Talley Leger, Chief Market Strategist
June 19, 2026
Why Infinite Space May Not Equal Infinite Value
A couple of weeks ago, I explored some thoughts and related research questions about the space economy. While it’s a thrilling time to look upward and outward, scaling and valuing an industry that may operate beyond our lifetimes and investable horizons requires a sober perspective.
This week, I illustrate the brutal reality of the Time Value of Money (TVM) and compound interest, which Albert Einstein referred to as the “eighth wonder of the world.” It’s tempting to think that the universe is physically infinite, so the economic value waiting to be extracted is also infinite. Mathematically and economically, however, that may be unrealistic.
Over the next century, imagine that humanity succeeds in creating an interstellar civilization worth quadrillions of dollars annually. Spoiler alert: 100 years of compounding at 5% is so powerful that it reduces an infinite stream of $1 quadrillion (Q) of annual revenues down to a lump-sum present value (PV) of $152.1 trillion (T) in today’s dollars (see the table below)!
The present value of an infinite perpetuity

Sources: WCG, 6/15/26. Notes:Forecasts and projections are for informational purposes only, may not come to pass, are not guarantees of future results, and are subject to change without notice.
To determine the PV of an infinite stream of annual cashflows starting 100 years in the future, the calculation must be broken into a two-step valuation model:
- Perpetuity Value: Calculate the lump-sum value of the infinite $1Q annual cashflows at the end of the forecasting horizon (i.e., year 100).
- Present Value Discount: Discount that massive future lump sum back to the present day (i.e., year zero) to account for the 100-year time horizon at a 5% discount rate.
Let’s treat our interstellar economy as a “going concern” that produces cashflows of $1Q annually, every single year, forever, starting in year 100. Assuming the first annual cash flow occurs at the end of year 100 (which is “capitalized” in year 100), here’s the step-by-step mathematical breakdown:
First, we must calculate what an infinite stream of $1Q is worth in year 100, which is $1Q divided by 5% or $20Q.

Second, we must discount that entire infinite block of value back to the present day:

Where PV = $20Q / [(1.05)^100] = $152.1T
A 100-year TVM “Growth-Decay” Curve
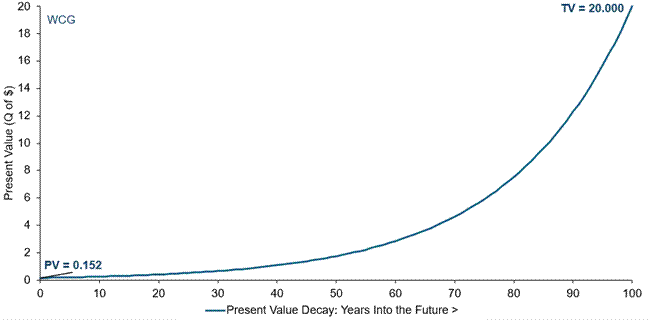
Sources: WCG, 6/15/26. Notes: PV = Present value. TV = Terminal value.
Even if humanity successfully builds an economy capable of generating an infinite stream of $1Q per year, the brutal compounding power of the TVM over a century eliminates 99.24% of its PV today (see the chart above)!
At a 5% discount rate, the entire infinite multi-planetary future of our civilization is worth exactly $152,089,799,957,470 in today’s dollars – remarkably close to the current market capitalization of Earth’s stock market (see the chart below)!
$150T may become an early waypoint, rather than an upper limit
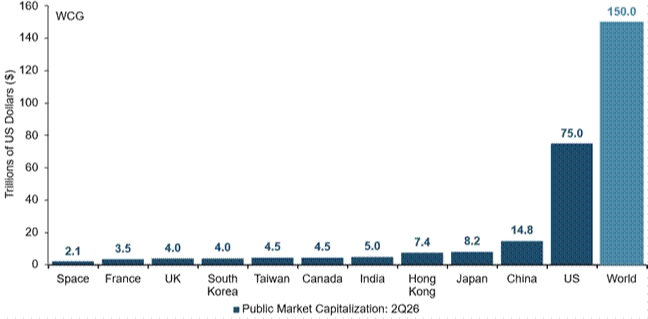
Sources: Google, Visual Capitalist, WCG, 6/15/26. Notes: UK = United Kingdom. US = United States.
For any investable timeline today, Earth remains the primary engine and ultimate consumer until we encounter and trade with other planets and civilizations. If humanity transitions to a multi-planetary species – moving toward a Kardashev Type I or II civilization that harnesses the total energy of our local star system – Earth’s current market cap of roughly $150 trillion may be a reasonable longer-term theoretical lower bound.
Mechanically, my “Earth market cap” target implies a raw expansion of 7,043% or a growth multiple of 71.4x for the space sector’s current market cap ($2.1T) to equal the current global market cap of all public equities on our planet ($150 trillion).
What’s Earth’s stock market trying to tell us now?
When the theoretical baseline of our multi-planetary future ($152.1T) harmonically converges with the current aggregate value of our terrestrial reality ($150T), it’s a message worth decoding. If global equities are the ultimate, forward-looking discounting mechanism, they may be telling us two distinct, highly provocative stories.
Choose Your Own Adventure:
1. The Capitalist “Event Horizon”
Did you see the 1997 sci-fi film, Event Horizon? In this Market Strategy adventure, stocks have a definitive, mathematical edge of vision.
Astrophysicists call it the “observable universe” – the absolute limit of what we can see before the speed of light cuts us off. Investors have an “observable universe,” too, and it’s governed by the discount rate. In other words, the PV of $152.1T means the stock market can’t see past the 21st century. The compounding gravity of a 5% hurdle rate creates a financial “event horizon” 80 - 100 years hence.
Stocks aren’t necessarily saying an interstellar future will happen; they’re saying even if it does happen, eternity is completely worthless to a (human) trader today. In short, capitalism’s absolute speed limit is equal to one human lifespan … until we solve the longevity problem, too.
2. The Human “Survival Premium” is Priced In
On a macroscopic scale, the Efficient Market Hypothesis (EMH) sends an incredibly optimistic message: Humanity’s transition to a Kardashev Type I civilization is mostly priced in!
If the stock market genuinely believed we were going to wipe ourselves out via climate collapse, nuclear war or asteroid impact in the next few decades, the global market cap would be heavily discounted for that “existential” risk. Instead, it’s trading eerily close to the PV of a species that successfully scales the solar system. Collectively, investors are placing a $150T bet that we survive, adapt and eventually generate a $1Q orbital economy.
Bottom Line: Earth’s current market cap of $150T isn’t just pricing in next quarter’s or even next year’s earnings. Rather, $150T is effectively the baseline “strike price” for the continuation of the human species.
Portfolio Strategy
by Jim Worden, CFA®, CMT®, CAIA®, Chief Investment Officer
June 19, 2026
An Update on AI Tools
It’s been a few years since the launch of ChatGPT in November 2022. We have seen a plethora of new companies emerge as AI has become a much greater focus for consumers as well as companies.
A recent personal experience of mine highlights this.
As part of my normal research process, I review roughly 5,000 charts a few times a year. I am looking for different types of trends, including potential technical breakouts, reversals, and stable trends that are sometimes synonymous with companies experiencing lower volatility. I label anything that looks interesting with a 1 and anything that is in a clear downtrend or sideways, choppy price movement as a 0. It takes several days to go through this process.
Recently, I used some AI tools to help with this research, constraining them to work as assistants. Nothing proprietary or sensitive. Just publicly available information to organize for my process.
The 5,000 charts are typically spread across a 140-page PDF, with 36 stock charts per page.
AI gave me ideas for planning the project, suggested some possible tools to use, and gave me an estimated budget for items that didn’t fall under a normal subscription. It gave me ideas on how best to organize and analyze the data.
One tool converted the 140 pages into 5,000 image files and organized them by label. Another tool created Python code with instructions on what to look for, how to translate my notes with a “/” equaling a 1 and no markup equaling a 0, and how to interpret charts representing breakouts with a B, reversals with an R, and stable trends with an S.
All in all, it took about 15 minutes to convert the 140-page PDF into 5,000 independent images and another 20 minutes for another AI tool to read, analyze, and index my marks, as well as provide an independent analysis based on what I wanted to look at via the Python code. The cost for the monthly subscription was $20. The cost to upload and analyze the 5,000 stocks was $10.
Did it work perfectly right out of the gate? No. Was it well worth the time spent to build the process and run it? Absolutely!
Why do I bring this all up and get into this level of detail? Because there are many out there who say AI is either not working well enough or is working so well that we are all going to be out of work, living in some sort of Skynet-ruled world.
As is often the case, the truth, in my opinion, lies somewhere in the middle. To be clear, AI, in my opinion, isn’t going away. This is not a fad that we will likely see go away. But I also don’t believe that AI will completely run all of our lives and replace all of our jobs, at least not anytime soon.
AI will, for many people, remain a research assistant-like tool. Think of the smartest intern out there and multiply it by 100 or 1,000. A human couldn’t possibly hold all that information at their fingertips. But AI is still an intern. It is still learning. It still makes a lot of mistakes. It still sometimes confuses context or makes inappropriate assumptions. Like any good mentor to a talented apprentice, we need to be very clear and very explicit with instructions and what role the tool should play and when. If we don’t, the tool may just pull information out of thin air, or hallucinate, which is dangerous and wasteful.
Will the models get smarter? Yes, many newer iterations are getting faster and smarter and are making fewer errors. But they still make errors. Accuracy varies widely by model, benchmark, and task. On several widely cited industry benchmarks, leading models now score well above 60%, while on harder or more specialized tests, scores can still fall closer to or below that level.[1] But can they save us a lot of time and organize things for us better than we could? Most often, I have found that they can.
I have also found it helpful to use multiple AI tools, ask for citations or references, and ask lots of follow-up questions, often using a factual dataset as the arbiter of what is accurate.
The assistant-tool use of AI is clearly different than a complete replacement that some have suggested would occur.
Some of the talking heads out there originally suggested that radiologists would be completely replaced by AI. But what happened? Radiology continues to face workforce shortages amid rising imaging volumes, and AI is increasingly being discussed as a tool to support radiologists rather than replace the profession. With AI assistants, radiologists may be able to review images more efficiently, but a human still needs to apply clinical judgment, context, and accountability. The premise from some “experts” was that AI would be massively disruptive, but it wasn’t in the way some expected. I believe there are probably several areas where some may think it will be very disruptive and it won’t. There are also likely areas where it will be more disruptive than what the “experts” are saying. Rule of thumb, for me, take everything the “experts” say with a grain—or two, or several grains—of salt.[2]
Source notes
[1] Benchmark note: Standard AI benchmarks are not directly comparable because scores depend on the model version, harness, sampling, tools, and reasoning or effort settings. Recent official model releases and model cards show wide ranges. Examples: GPT-5.5 scored 93.6% on GPQA Diamond, 58.6% on SWE-Bench Pro (Public), 81.2% on MMMU Pro (no tools), and 41.4% on Humanity’s Last Exam without tools (OpenAI, “Introducing GPT-5.5,” Apr. 23, 2026). Claude Sonnet 4.6 scored 89.9% on GPQA Diamond, 79.6% on SWE-bench Verified, 74.5% on MMMU-Pro without tools, and 33.2% on Humanity’s Last Exam without tools (Anthropic, “Claude Sonnet 4.6 System Card,” Feb. 2026). Grok 4 Fast scored 85.7% on GPQA Diamond, 92.0% on AIME 2025 without tools, 80.0% on LiveCodeBench, and 20.0% on Humanity’s Last Exam without tools (xAI, “Grok 4 Fast,” Sept. 19, 2025). Gemini 3.1 Pro scored 94.3% on GPQA Diamond, 80.6% on SWE-Bench Verified, 80.5% on MMMU-Pro without tools, 54.2% on SWE-Bench Pro, and 44.4% on Humanity’s Last Exam without tools (Google DeepMind, “Gemini 3.1 Pro,” Feb. 2026).
[2] Radiology note: See American College of Radiology, “The Radiologist Shortage: A Workforce Update from HPI,” Feb. 5, 2026; American College of Radiology, “AI Is a Tool for Radiology, Not a Replacement for the Profession,” Oct. 2, 2023; and UAB Reporter, “This radiologist is helping doctors see through the hype to an AI future,” Dec. 5, 2022.
Definitions
Market Cap is the total dollar value of a public company’s outstanding shares of stock. It’s calculated by multiplying a company’s total shares by the current market price of a single share.
TVM is a core financial concept stating that a sum of money in your hand right now is worth more than the exact same sum promised in the future. That’s because money today can earn interest, grow through investments and avoid the eroding effects of inflation.
One of the foundational equations of finance, the standard perpetuity formula is PV = CF / r, where PV = present value, CF = cash flow per period, r = discount rate.
The Gordon Growth Model is PV = CF1 / r - g, where CF1 = next period’s cash flow, r = discount rate, and g = perpetual growth rate.
The Kardashev Scale is a framework proposed in 1964 by the Soviet astronomer Nikolai Kardashev to classify civilizations according to the amount of energy they can harness and use.
A Type I Civilization (Planetary Civilization) can utilize essentially all the energy available on its home planet.
A Type II Civilization (Stellar Civilization) can utilize a substantial fraction of the total energy output of its star.
The EMH states that stock prices always show all available information. As such, it’s difficult for investors to beat the market or buy undervalued stocks.
Artificial intelligence (AI): Software designed to perform tasks commonly associated with human cognition, such as identifying patterns, summarizing information, generating code, or organizing data.
AI model / large language model (LLM): A machine-learning system trained on large datasets to interpret or generate text, code, images, or other information.
Benchmark: A standardized test used to compare AI models on a specific task. Benchmark results depend on the model version, test setup, prompt, tool access, and evaluation methodology.
Hallucination: An AI-generated output that may sound confident or plausible but is inaccurate, incomplete, or unsupported by the underlying facts.
Python: A programming language commonly used to automate data processing, analysis, and reporting tasks.
Technical breakout: A price move above a prior resistance level or trading range that may suggest improving momentum.
Reversal: A potential change in the direction of a price trend.
Stable trend: A price pattern that has generally moved in a consistent direction with lower relative volatility.
Volatility: The degree to which an investment’s price fluctuates over time.
Disclosures
The opinions expressed are those of the author as of the date of publication and are subject to change without notice.
This material is provided for informational and educational purposes only and should not be construed as individualized investment advice, a recommendation, or an offer to buy or sell any security, strategy, or product.
References to AI tools, software, benchmarks, or vendors are for illustrative purposes only and should not be interpreted as an endorsement or recommendation. Costs, timing, features, and availability may vary by provider, subscription level, usage, and future product changes.
AI tools can produce inaccurate, incomplete, outdated, or unsupported outputs. Human review, independent verification, and appropriate controls remain important, particularly when using AI in research, investment, compliance, legal, or client-facing processes.
AI benchmark results are not directly comparable across providers unless the same model version, evaluation harness, prompts, tools, sampling settings, and methodology are used. Benchmark scores may not reflect real-world performance in all use cases.
Technical analysis and chart review rely on historical price and volume patterns. These methods are not guarantees of future results and should generally be considered alongside fundamental, quantitative, risk, and portfolio-level considerations.
Source information is believed to be reliable, but accuracy, completeness, and timeliness are not guaranteed. Readers should not rely on any single source or AI-generated output without additional review.
Investing involves risk, including the possible loss of principal. Past performance is not a guarantee of future results.
The views expressed are for informational and educational purposes only and are subject to change without notice.
This material is not intended as, and should not be interpreted as, individualized investment advice or a recommendation to buy, sell, or hold any security, sector, industry, or investment strategy.
References to specific companies, securities, sectors, or industries are for illustrative purposes only and should not be construed as investment recommendations.
Investing involves risk, including the possible loss of principal. Investments in a specific industry or sector may involve greater risk and volatility than more diversified investments.
Past performance is not indicative of future results. No investment strategy can guarantee a profit or protect against loss.
Forward-looking statements, including views about future demand, pricing, supply, or industry cycles, are based on current expectations and assumptions and are subject to risks and uncertainties. Actual results may differ materially.
Data and information are believed to be reliable, but accuracy, completeness, and timeliness are not guaranteed. Source documents should be retained for factual claims, third-party research references, and company-specific data.
Portfolio holdings, allocations, and risk budgets are subject to change based on market conditions, client objectives, and investment guidelines.
The author, firm, clients, or related persons may hold positions in securities mentioned and may buy or sell those securities without notice, subject to applicable policies and regulations.
Securities offered through LPL Financial, Member FINRA/SIPC. Investment Advice offered through WCG Wealth Advisors, LLC, an SEC Registered Investment Advisor. WCG Wealth Advisors, LLC and The Wealth Consulting Group are separate entities from LPL Financial. Index performance is shown for illustrative purposes only and does not predict or depict the performance of any investment. Past performance does not guarantee future results.
All information in this report is believed to be from reliable sources; however, WCG Wealth Advisors, LLC, makes no representation as to its completeness or accuracy.
In general, stock values fluctuate, sometimes widely, in response to activities specific to the companies as well as broad market, economic and political conditions. Stock investing involves risks, including fluctuating prices and loss of principal. Value investments can perform differently from the market as a whole. They can remain undervalued by the market for long periods of time. (135-LPL) International investing involves special risks such as currency fluctuation and political instability and may not be suitable for all investors. These risks are often heightened for investments in emerging markets. (93-LPL)
Bonds are subject to market and interest rate risk if sold prior to maturity. Bond values will decline as interest rates rise. Bonds are subject to availability, change in price, call features and credit risk. (116-LPL)
The fast price swings in commodities will result in significant volatility in an investor’s holdings. Commodities include increased risks, such as political, economic, and currency instability, and may not be suitable for all investors. (122-LPL)
Rebalancing a portfolio may cause investors to incur tax liabilities and/or transaction costs and does not assure a profit or protect against a loss. (28-LPL)
There is no guarantee that a diversified portfolio will enhance overall returns or outperform a non-diversified portfolio. Diversification does not protect against market risk. (26-LPL)
Standard deviation is a historical measure of the variability of returns relative to the average annual return. If a portfolio has a high standard deviation, its returns have been volatile. A low standard deviation indicates returns have been less volatile. (131-LPL)
This is for educational / general purposes only, does not constitute investment, tax or legal advice and should not be relied on as such. This is not to be construed as an offer to buy or sell any financial instruments. Any strategies discussed are not intended to be relied upon as the sole factor in making an investment decision for any individual. As with all investments there are associated inherent risks. Please obtain and review all financial material carefully before investing. All material presented is compiled from sources believed to be reliable and current, but accuracy cannot be guaranteed. The opinions voiced in this material are for general information only and are not intended to provide specific advice or recommendations for any individual. All performance referenced is historical and is no guarantee of future results. All indices are unmanaged and may not be invested in directly. These comments should not be construed as recommendations but as an illustration of broader themes.
Forward-looking statements are not guarantees of future results. They involve risks, uncertainties and assumptions; there can be no assurance that actual results will not differ materially from expectations. In addition, forward-looking statements, including index targets or market scenarios, are hypothetical in nature, reflect current views and assumptions and are subject to change based on market and economic conditions and are not guarantees of future performance. This is a hypothetical example and is not representative of any specific investment. Your results may vary. (88-LPL) Scenario outcomes are illustrative and not predictive. This does not constitute a recommendation of any investment strategy or product for a particular investor. Investors should consult a financial professional before making any investment decisions.
The S&P 500 is a stock market index tracking the stock performance of 500 of the largest companies listed on stock exchanges in the United States. Indexes are unmanaged and cannot be invested in directly. (102-LPL)
Government bonds and Treasury bills are guaranteed by the US government as to the timely payment of principal and interest and, if held to maturity, offer a fixed rate of return and fixed principal value.
Publication Date: June 19, 2026
For Public Use in the US
The Wealth Consulting Group
LPL 1127383