

Market Strategy
by Talley Leger, Chief Market Strategist
July 10, 2026
Did You Say ‘Over?’
In the immortal words of John (Bluto) Blutarsky from the 1978 film, Animal House: “What? Over? Did you say ‘over?’ Nothing is over until we decide it is!”
As we expected, the S&P 500 Index has put on an impressive performance, logging a powerful 20%+ rally over the past year. In tense operating environments like this, it’s understandable for investors to look at a steep price chart and instinctively assume that the stock market’s overextended, exhausted and ripe for a major reversal.
As I argued last week, however, price action is only part of the story. To gauge the durability and sustainability of this bull market, we should also assess sentiment and positioning. On that score, the data deliver a clear message: The stock market has plenty of wall to climb. In other words, responsible stewards of capital like us will always find something to worry about, but extreme bullishness isn’t one of them.
Running With the Bulls
My proprietary Sentiment & Positioning Indicator (SPI) – which combines seven reliable market metrics – sends a surprisingly sober signal. Commercial attitudes towards US large market capitalization equities are neutral at just 0.3 standard deviations (SD) above their long-term average (see the charts below).
The stock market has plenty of wall to climb
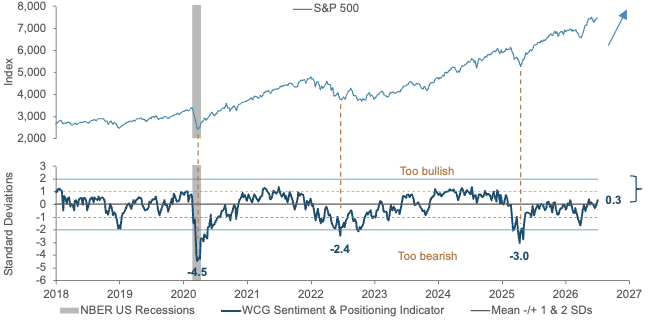
Sources: AAII, Bloomberg, FRED, WCG, 7/7/26. Notes: NBER = National Bureau of Economic Research. SD = Standard deviation. The blue arrow in the top chart indicates an uptrend in technical analysis. The dotted copper lines in the charts connect bearish extremes to stock market troughs. Indices are unmanaged and cannot be invested in directly. Past performance does not guarantee future results.
Persistent Pessimism
A closer look at the individual components of the SPI reveals why the aggregate reading remains so well-behaved.
- AAII Bull-Bear Spread: Despite the surge in share prices since April 2025, this classic survey of retail sentiment remains shockingly inverted (-10.9%), meaning more investors identify themselves as bears (42.3%) than bulls (31.4%).
- Contrarian Logic: While it may seem counter-intuitive, a chronic bearish bias amidst a historic equity rally is quite positive from a contrarian perspective. Why? Historically, extreme optimism tends to accompany late-cycle market dynamics because investors are fully committed. By contrast, persistent pessimism suggests incremental buyers are still available.
- Dry Powder: Market participants are hesitant, suspicious and outright fearful, which is consistent with the significant institutional and retail capital remaining on the sidelines, ready to buy the dips and support the next leg higher.
That’s literally what we mean when we say that stocks climb a “wall of worry.”
When to Worry
Looking ahead, my enthusiasm should endure until investor sentiment and positioning become too bullish once again. Specifically, I’m unlikely to wave the checkered flag on the stock market rally until the SPI breaches the 1-2 SD band.
Even when that upper threshold is eventually achieved, it’s important for practitioners to understand that the SPI works better near big bottoms than it does around major market tops. In other words, stocks can continue to grind higher after sentiment and positioning start boiling over as late buyers are forced into the market. When that happens, I’ll be sure to alert WCG advisors and their clients. In the meantime, investors should respect the rally, not fear it.
Portfolio Strategy
by Jim Worden, CFA®, CMT®, CAIA®, Chief Investment Officer
July 10, 2026
A Bubble or Not?
Our family, like many, gathered together and enjoyed a wonderful meal this past weekend as we celebrated the 250th anniversary of our country. The patriotic person that my mom is, she had several red, white, and blue balloons decorating their living room. The balloons stayed intact through most of the dinner, but my niece’s dog Rio just couldn’t help herself. We heard several pops toward the end of our meal.
The popping balloons, sights of exploding fireworks, and some investors questioning where we are in the cycle got me thinking about the current equity markets and whether we are in a bubble.
From the bottom of the bear market on October 13, 2022, until now, the S&P 500 Index is up more than 114% through July 8, 2026, per Bloomberg. We have had some bouts of volatility related to tariffs, geopolitical conflict, and the current AI CAPEX cycle, but markets have generally trended higher. Some stocks adjacent to AI spending have seemingly gone straight up. According to Bloomberg, if we annualize the S&P 500 Index’s return from that low in October to now, the market has returned 22.63% per year!
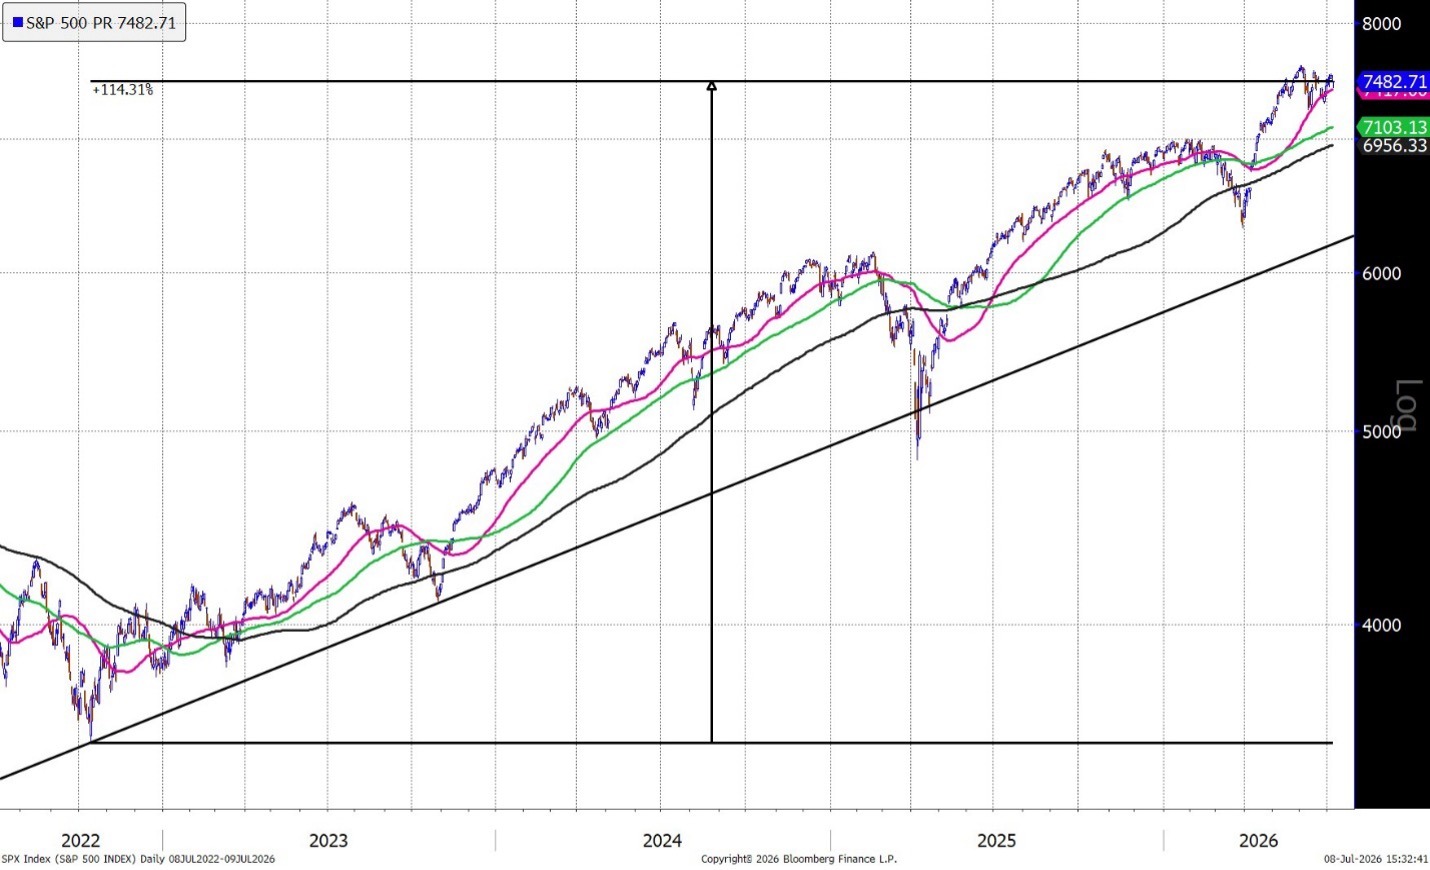
For the uninitiated in economic or market analysis and the history of bubbles, that alone might seem like we are in a bubble. And there certainly does seem to be some hype and ebullience around some stocks that have been life-changing for some investors. Based on what I hear or read, there are also those investing like they’re in a casino.
So we have the following that looks bubble-like:
- Solid performance (114% from the last bear market bottom on October 13, 2022).
- Ebullience among some investors (SpaceX created 4,400 millionaires, nearly 400 worth $100 million or more, New York Times, June 12, 2026; SNDK up 5,755% from its 52-week low to its 52-week high, Bloomberg).
- High margin debt balances ($1.42 trillion, per FINRA, May 2026).
- Cyclically Adjusted Price-to-Earnings (CAPE) ratio of 39.5 (Bloomberg, 7/8/26).
- Information Technology makes up 37.29% of the S&P 500 Index (Bloomberg, 7/8/26).
- The top 10 companies in the S&P 500 Index make up approximately 37% of the index (Bloomberg, 7/8/26).
- Buffett Indicator (total market cap/GDP) at 236% as of 7/6/26.
And we have things that don’t look like a bubble:
- Per data from AAII and Bloomberg, 42% of retail investors were bearish while just 31% were bullish as of 7/2/26. Real bubbles usually happen when there are more bulls than bears, not the opposite.
- 68% of S&P 500 Index members are above their 200-day moving average. This figure was over 80% in May 1999 and over 97% in April 2021. There are enough companies in deep drawdowns that this does not feel like a bubble.
- According to Bloomberg, 33% of the one-year return of the S&P 500 Index has been related to earnings growth, while -9% has been attributed to forward P/E multiple contraction. We usually see bubbles when the P/E multiple expands, not contracts.
- As has been mentioned here before, investors have approximately $8 trillion sitting in money market accounts (Bloomberg, Federal Reserve, July 1, 2026). Investors usually do not sit on a large amount of cash during bubbles.
- Consumer sentiment is still near multi-decade lows (University of Michigan, 6/30/26). If people are not feeling great about the current environment, this usually does not feed into a bubble.
As they say in technical analysis, we like to look at the “weight of the evidence” when it comes to indicators that sometimes run contrary to each other. In my opinion, we are not in bubble territory yet. We could get there if more of the parabolic price moves that are now isolated to certain parts within the semiconductor sector bleed into other areas of the market. But they aren’t. The areas of concern seem to be related to supply/demand disequilibrium, with real dollars, profits, and higher margins seemingly supporting much of the price gains. We could also get more non-bubble volatility if geopolitical conflict with Iran drags on and on or if the Fed sets its sights more on hikes. We could see a bubble form and subsequently pop if credit and leverage expand too fast before becoming a major concern—with widening spreads, less liquidity, and tighter financial conditions. We’re nowhere near there at this point.
Perhaps my favorite review of bubble calling:
Goetzmann (NBER, WP 21693), “Bubble Investing: Learning from History,” cites that markets are more likely to double again than to halve. Bubble calling has a terrible hit rate.
We will continue to monitor all of these factors and make adjustments as needed to stay diversified, manage risks, and, when appropriate, take profits.
Definitions
The S&P 500 is an index that tracks the stock performance of 500 of the largest companies listed on exchanges in the United States. Indices are unmanaged and cannot be invested in directly.
The WCG Sentiment & Positioning Indicator (SPI) includes the following 7 metrics: 1) The US Economic Policy Uncertainty Index; 2) the CBOE Volatility Index (VIX); 3) the AAII Sentiment Survey Bull-Bear Spread; 4) the percentage of S&P 500 stocks above their 200-day moving averages; 5) the S&P 500’s deviation from its 200-day moving average; 6) the CBOE Total Put-to-Call (P/C) Ratio; and 7) Moody’s Seasoned Baa Corporate Bond Spread. Those metrics have been combined and expressed in common units of standard deviations away from their average.
Standard deviation (SD) is a historical measure of the variability of an asset’s returns or valuations relative to its average return or valuation. If an asset has a high standard deviation, its returns have been volatile. A low standard deviation indicates returns have been less volatile.
The National Bureau of Economic Research (NBER) defines a recession as a significant decline in economic activity that is spread across the economy and lasts more than a few months. Recessions are the periods between peaks and troughs of the business cycle.
S&P 500 Index: A market-capitalization-weighted index of 500 leading publicly traded U.S. companies. It is unmanaged and cannot be invested in directly.
CAPE Ratio: The Cyclically Adjusted Price-to-Earnings ratio, a valuation measure that compares price to inflation-adjusted average earnings over a 10-year period.
Forward P/E Ratio: A valuation measure that compares price to expected future earnings.
Buffett Indicator: A valuation measure comparing total U.S. stock market capitalization to U.S. gross domestic product. Methodologies can vary by source.
200-day Moving Average: A long-term trend indicator showing the average closing price over the prior 200 trading days.
Margin Debt: Money borrowed by investors to purchase securities. Leverage can magnify both gains and losses.
Money Market Accounts/Funds: Cash or cash-like vehicles that generally seek liquidity and capital preservation but are not equivalent to bank deposits unless specifically structured and insured as such.
AI CAPEX: Capital expenditures related to artificial intelligence infrastructure, equipment, and related technology investment.
Disclosures
This commentary is for informational and educational purposes only and should not be construed as individualized investment, legal, or tax advice.
Opinions expressed are those of the author as of the date of publication and are subject to change without notice.
Past performance is not indicative of future results. Investing involves risk, including the possible loss of principal.
Indexes are unmanaged, do not include fees or expenses, and cannot be invested in directly.
References to specific securities, sectors, or market segments are for illustrative purposes only and should not be construed as a recommendation to buy, sell, or hold any security.
Data cited is believed to be reliable and is attributed to the referenced sources and dates, including Bloomberg, AAII, FINRA, the Federal Reserve, the University of Michigan, NBER, and other sources noted in the text. No representation is made as to the accuracy or completeness of third-party data.
Diversification and risk management do not guarantee a profit or protect against loss in declining markets.
The views expressed are for informational and educational purposes only and are subject to change without notice.
This material is not intended as, and should not be interpreted as, individualized investment advice or a recommendation to buy, sell, or hold any security, sector, industry, or investment strategy.
References to specific companies, securities, sectors, or industries are for illustrative purposes only and should not be construed as investment recommendations.
Investing involves risk, including the possible loss of principal. Investments in a specific industry or sector may involve greater risk and volatility than more diversified investments.
Past performance is not indicative of future results. No investment strategy can guarantee a profit or protect against loss.
Forward-looking statements, including views about future demand, pricing, supply, or industry cycles, are based on current expectations and assumptions and are subject to risks and uncertainties. Actual results may differ materially.
Data and information are believed to be reliable, but accuracy, completeness, and timeliness are not guaranteed. Source documents should be retained for factual claims, third-party research references, and company-specific data.
Portfolio holdings, allocations, and risk budgets are subject to change based on market conditions, client objectives, and investment guidelines.
The author, firm, clients, or related persons may hold positions in securities mentioned and may buy or sell those securities without notice, subject to applicable policies and regulations.
Securities offered through LPL Financial, Member FINRA/SIPC. Investment Advice offered through WCG Wealth Advisors, LLC, an SEC Registered Investment Advisor. WCG Wealth Advisors, LLC and The Wealth Consulting Group are separate entities from LPL Financial. Index performance is shown for illustrative purposes only and does not predict or depict the performance of any investment. Past performance does not guarantee future results.
All information in this report is believed to be from reliable sources; however, WCG Wealth Advisors, LLC, makes no representation as to its completeness or accuracy.
In general, stock values fluctuate, sometimes widely, in response to activities specific to the companies as well as broad market, economic and political conditions. Stock investing involves risks, including fluctuating prices and loss of principal. Value investments can perform differently from the market as a whole. They can remain undervalued by the market for long periods of time. (135-LPL) International investing involves special risks such as currency fluctuation and political instability and may not be suitable for all investors. These risks are often heightened for investments in emerging markets. (93-LPL)
Bonds are subject to market and interest rate risk if sold prior to maturity. Bond values will decline as interest rates rise. Bonds are subject to availability, change in price, call features and credit risk. (116-LPL)
The fast price swings in commodities will result in significant volatility in an investor’s holdings. Commodities include increased risks, such as political, economic, and currency instability, and may not be suitable for all investors. (122-LPL)
Rebalancing a portfolio may cause investors to incur tax liabilities and/or transaction costs and does not assure a profit or protect against a loss. (28-LPL)
There is no guarantee that a diversified portfolio will enhance overall returns or outperform a non-diversified portfolio. Diversification does not protect against market risk. (26-LPL)
Standard deviation is a historical measure of the variability of returns relative to the average annual return. If a portfolio has a high standard deviation, its returns have been volatile. A low standard deviation indicates returns have been less volatile. (131-LPL)
This is for educational / general purposes only, does not constitute investment, tax or legal advice and should not be relied on as such. This is not to be construed as an offer to buy or sell any financial instruments. Any strategies discussed are not intended to be relied upon as the sole factor in making an investment decision for any individual. As with all investments there are associated inherent risks. Please obtain and review all financial material carefully before investing. All material presented is compiled from sources believed to be reliable and current, but accuracy cannot be guaranteed. The opinions voiced in this material are for general information only and are not intended to provide specific advice or recommendations for any individual. All performance referenced is historical and is no guarantee of future results. All indices are unmanaged and may not be invested in directly. These comments should not be construed as recommendations but as an illustration of broader themes.
Forward-looking statements are not guarantees of future results. They involve risks, uncertainties and assumptions; there can be no assurance that actual results will not differ materially from expectations. In addition, forward-looking statements, including index targets or market scenarios, are hypothetical in nature, reflect current views and assumptions and are subject to change based on market and economic conditions and are not guarantees of future performance. This is a hypothetical example and is not representative of any specific investment. Your results may vary. (88-LPL) Scenario outcomes are illustrative and not predictive. This does not constitute a recommendation of any investment strategy or product for a particular investor. Investors should consult a financial professional before making any investment decisions.
The S&P 500 is a stock market index tracking the stock performance of 500 of the largest companies listed on stock exchanges in the United States. Indexes are unmanaged and cannot be invested in directly. (102-LPL)
Government bonds and Treasury bills are guaranteed by the US government as to the timely payment of principal and interest and, if held to maturity, offer a fixed rate of return and fixed principal value.
Publication Date: July 10, 2026
For Public Use in the US
The Wealth Consulting Group
LPL 1137990