

Market Strategy
by Talley Leger, Chief Market Strategist
August 7, 2026
Corporate Productivity: The “Flywheel” Is Spinning
Every great investment thesis eventually comes down to one question: Can companies keep growing their earnings? I believe the answer lies in an overlooked positive “feedback loop” hiding in plain sight: Today’s sales create capital expenditures (capex), capex creates productivity and productivity creates tomorrow’s sales.
Virtuous Circle
- Present sales validate demand,
- Demand justifies capex,
- Capex raises productivity,
- Productivity – and successful execution – create future sales.
At first glance, sales appear to drive capex in a simple one-way relationship, but that’s only part of the story. Once companies invest, those investments raise productivity, generate new demand and create the next wave of revenues. Conceptually, corporate America operates a self-reinforcing “flywheel” for sustainable growth.
Institutional Inertia
In physics, a “flywheel” is a heavy, revolving wheel used in machinery to store rotational energy. It resists changes in speed, helping an engine run smoothly even when power drops. In business and marketing, a “flywheel” is a model where your winning strategies feed into each other to create unstoppable, self-sustaining growth.
Indeed, new and old economy segments alike have kept their “productivity promise” by harnessing a fundamental machine powered by the external energy source of demand. Think of demand as the ignition, present revenues as the jet fuel and capex as the gas turbine engine. Productivity provides the thrust that lifts future revenues even higher.
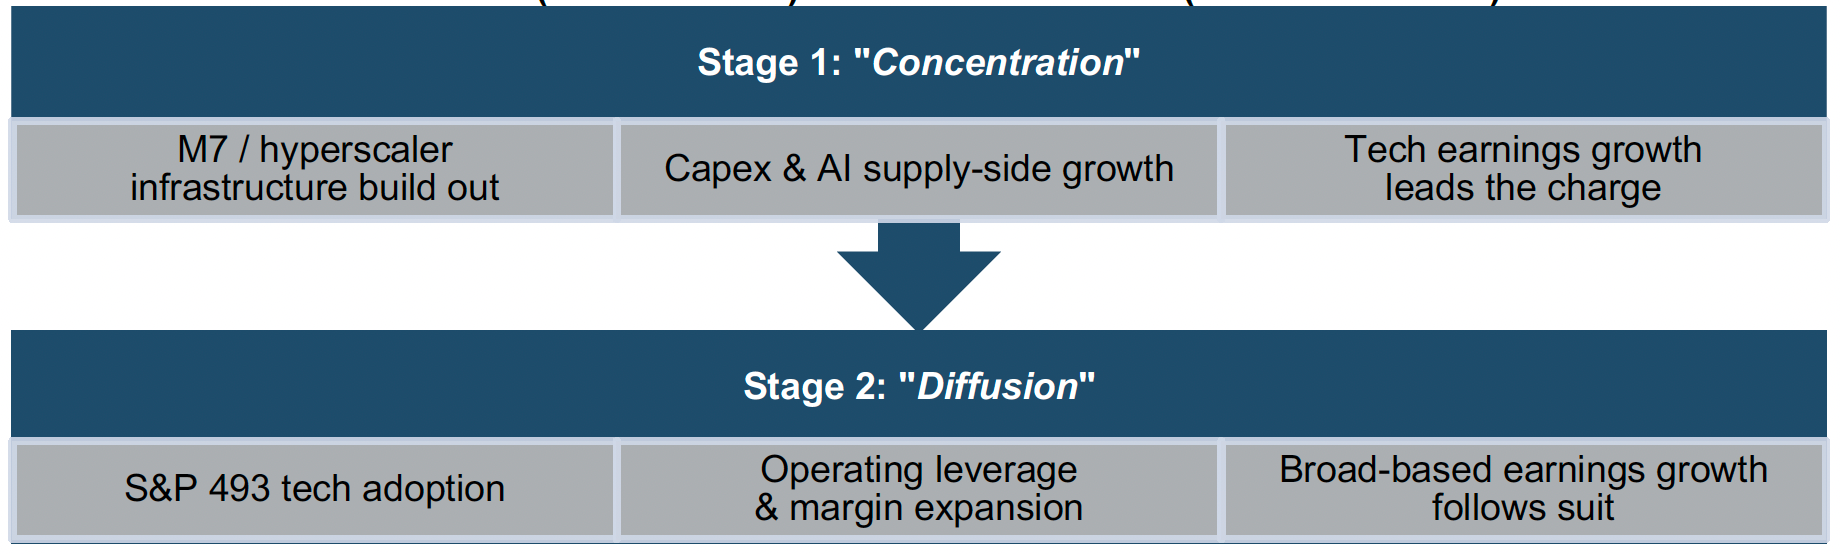
From Tech “Concentration” (M7 / builders) to Tech “Diffusion” (S&P 493 / users)
Sources: WCG, 08/03/26.
If You Build It, They Will Come
Last week, I introduced a simple, yet compelling framework for explaining why artificial intelligence (AI) doesn’t have to remain just an NVIDIA or “hyperscaler” story. My two-stage paradigm gives investors an intuitive way to think about how and why earnings leadership could broaden without requiring “Big Tech” to collapse (see the chart above).
Simply put, the benefits of AI are shifting from the builders to the users:
- Sales,
- Capex,
- Productivity,
- Margins,
- Earnings breadth,
- Broader market participation.
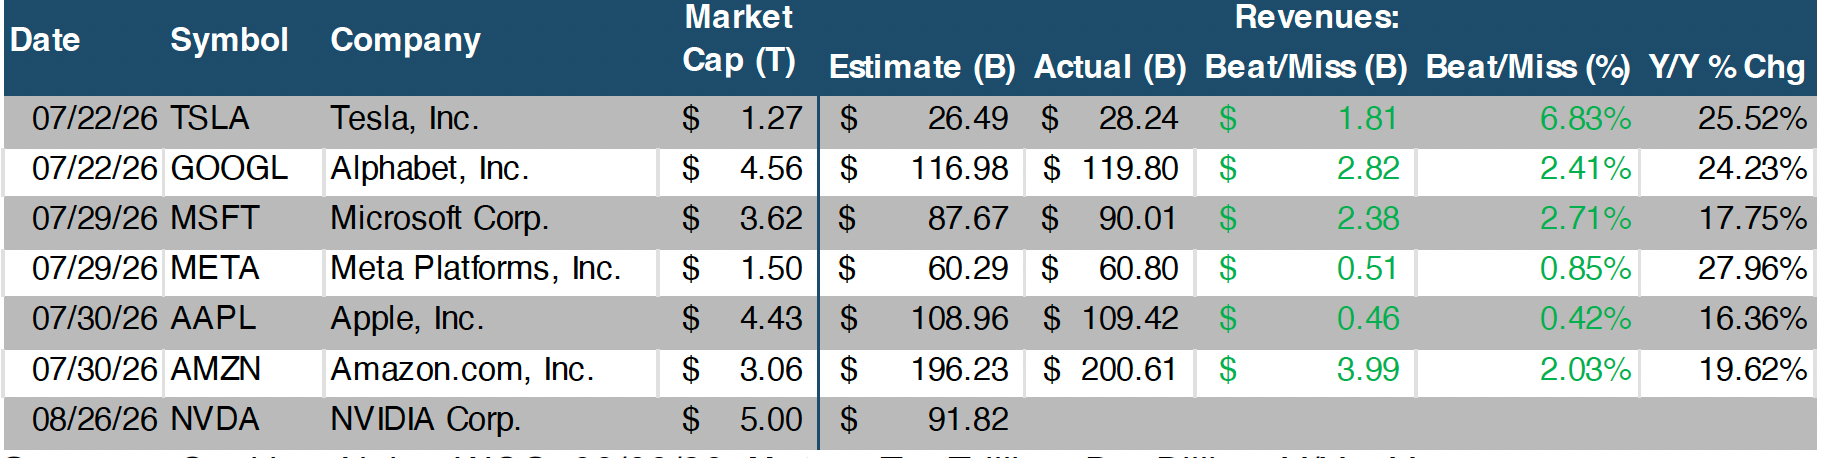
To be clear, markets don’t require the Magnificent Seven (M7) to stop growing. (Fortunately, the M7’s enjoying across-the-board double-digit revenue growth.) Rather, they simply require the rest of corporate America to start growing faster. That’s exactly what the productivity cycle suggests should happen: Demand is the spark plug, capex is the engine and productivity is the transmission that converts horsepower into forward motion.
Big Week for “Big Tech:” Plenty of Fuel in the Tank
Sources: Seeking Alpha, WCG, 08/03/26. Notes: T = Trillion. B = Billion. Y/Y = Year over year.
Winners and Losers
However, strong demand alone doesn’t guarantee equally strong earnings. As 2Q26 results demonstrate, converting top-line growth into bottom-line EPS growth depends on each company’s operating leverage, cost discipline and execution (see the surrounding tables).
Indeed, strong demand is only the starting point. Second-quarter reports underscore that companies can differ markedly in how effectively they convert revenues into productivity, margin expansion and ultimately earnings.
Importantly, management execution determines how much of those sales reach shareholders in the form of earnings:
- Revenue growth validates demand,
- EPS growth validates execution.
In short, strong demand gets companies onto the field; productivity, operating leverage and execution determine who wins the game.
Big Week for “Big Tech:” Varying Degrees of Operating Leverage and Execution

Sources: Seeking Alpha, WCG, 08/03/26. Notes:EPS = Earnings per share.
The Illusion of “Perpetual Motion”
If demand is the external energy source powering the productivity and earnings machine, what happens if / when demand slows? Naturally, the business cycle depends on sustained demand. If revenue growth were to sharply decelerate or even contract, companies would likely scale back their investment plans. At present, however, broad-based sales growth suggests that my “tech enablement” thesis is working and it’s premature to worry about a negative “feedback loop” and vicious circle.
Why Investors Should Care
Logically, market participants should be willing to pay higher multiples for businesses that can sustain the growth “flywheel” because durable productivity translates into durable earnings. In other words, you get what you pay for, and high quality deserves a high price.
As I’ve said, a healthy bull market doesn’t depend on seven extraordinary companies. It depends on hundreds of ordinary companies becoming more productive. That’s exactly what we’re beginning to see and it’s a key reason why I believe the earnings and market cycle may have further to run.
🤖 “Tech Enablement:” Why Strong Sales Drive Strong CapEx, May 15, 2026
Portfolio Strategy
by Jim Worden, CFA®, CMT®, CAIA®, Chief Investment Officer
August 7, 2026
Is It Really Different This Time?
Everything regarding the AI buildout and CAPEX seems massive. Nothing feels small or somehow overstated. It doesn’t look like there will be any slowing in 2027, either. Consensus estimates for 2027 cloud capital spending now sit at $1.2 trillion, a 30% increase, per Morgan Stanley1.
Compute and the demand for AI feel bigger than anything that most of us have ever seen. Rather than comparing it with the internet, which was extremely transformative, this feels closer to the invention and adoption of the steam engine.
And, unlike the internet, this doesn’t feel like an empty room akin to “if you build it, they will come.” They are already showing up en masse. ChatGPT broke the record for how quickly it reached 100 million active users—just two months! This compares with more than seven years for the World Wide Web (internet) to reach 100 million users2.
The internet now has five billion users3. According to Microsoft, 17.8% of the world’s working-age population is using AI4. That’s nearly one billion users in less than four years5. According to Microsoft, AI use is increasing, with usage in some countries at 60% or higher6.
The next question, which no investor can answer with 100% confidence, is, “How long will the cycles surrounding AI last?” These cycles7 are:
- Memory / components
- GPU / accelerator
- Financing / credit
- Physical infrastructure
- Adoption / productivity
Investors, ever the discounting bunch, are, of course, trying to discount how far into the future earnings will keep growing, how long profit margins will stay high, and when the cycle will ultimately unwind. Investors, from prior experience, know full well that things don’t last forever. Mean reversion eventually brings down companies that are too high and brings up companies that are too low—at least that’s the theory. But what if this time is a little different? What if earnings keep growing gangbusters for another 24 months? What if margins don’t come down meaningfully for another two to three years? If that’s the case—and we don’t claim to know whether it is—then the market could keep grinding higher, and earnings could keep surprising everyone for much longer.
Of course, we must look at both sides of what is possible. We have to plan for bad things to happen. That’s our job. But we also need to realize that betting against the current trends, is also inherently risky. It comes down to being diversified and prudent while also acknowledging that things might keep getting better for a period.
Footnotes:
- Investing.com, 8/3/26, Morgan Stanley sees cloud spending reaching $1.2 trillion in 2027.
- World Bank and ITU, Our World in Data, 1990 through 1997.
- World Bank and ITU, worldwide users as of 12/23/24.
- Microsoft’s Global AI Diffusion Report, 3/31/26.
- World Bank; the world’s working-age population is defined as individuals ages 15 to 64 and was estimated at 5.36 billion as of 12/31/25. ChatGPT was released on 11/30/22.
- Microsoft’s Global AI Diffusion Report, 3/31/26, noted an increase in AI usage from 16.3% to 17.8% from H1 2025 to Q1 2026. The UAE and Singapore had AI usage of 70.1% and 63.4%, respectively, as of Q1 2026.
- Cycle-length estimates: memory boom/bust—SemiAnalysis, UncoverAlpha (2026); GPU refresh—pre-2020 hyperscaler server-life assumptions, NVIDIA/CNBC (2025); credit—NBER post-WWII credit cycles averaged approximately 5.75 years (Western Asset); data-center systems—Uptime Institute, Intertek (shells last 15–30+ years); adoption lag—Brynjolfsson, Rock & Syverson (NBER WP 25148); David (1990).
Definitions
Sales or revenues: The total amount of money a company earns from selling its goods or services before any expenses are deducted. It represents the top line of the income statement.
Capex: Funds used by a company to acquire, upgrade and maintain physical assets such as property, buildings, or technology. These investments are aimed at expanding long-term operational capacity.
Margin: The percentage relationship between a company’s profits and its revenues, showing how much of each dollar earned turns into profit. Higher margins indicate greater financial efficiency and pricing power.
Productivity: A measure of economic performance that compares the volume of output produced to the inputs used, such as labor, capital or time. It reflects how efficiently a business converts resources into goods or services.
Operating leverage: A financial metric that measures how sensitive a company’s operating income is to changes in its sales or revenues. Companies with high fixed costs experience greater profit growth when revenues increase.
EPS: The portion of a company’s profit allocated to each outstanding share of common stock. It serves as a critical indicator of a corporation’s profitability for investors.
Generally Accepted Accounting Principles (GAAP): A standardized collection of accounting rules, mechanisms and procedures used by companies to compile their financial statements. These principles ensure consistency, transparency and comparability across financial reporting.
Hyperscaler: A massive cloud service provider that offers highly scalable cloud computing infrastructure and data centers to support global enterprise demands. Examples include Amazon Web Services, Microsoft Azure and Google Cloud.
NVIDIA: A leading technology company that designs graphics processing units (GPUs), application programming interfaces (APIs) and system-on-a-chip units (SoCs). The company is a dominant force in the AI market, providing the essential hardware and software infrastructure powering modern AI, data centers and high-performance gaming.
AI: The simulation of human intelligence processes by machines, especially computer systems. It enables software to perform complex tasks such as learning, reasoning, problem-solving and decision-making.
Artificial intelligence (AI): Computer systems designed to perform tasks commonly associated with human intelligence, including analyzing data and generating content.
Capital expenditures (CAPEX): Funds used to acquire, upgrade, or maintain long-term assets, such as data centers, servers, networking equipment, and other infrastructure.
Cloud capital spending: Capital expenditures by cloud-service providers to build or expand computing, storage, networking, and data-center capacity.
Compute: The processing capacity and related resources used to train and operate AI systems.
Consensus estimates: Aggregated forecasts from analysts or other market participants; they are subject to change and are not guarantees of future results.
GPU / accelerator: A specialized processor designed to perform large numbers of calculations in parallel, including calculations used in AI workloads.
Hyperscaler: A large cloud or data-center operator capable of rapidly expanding computing and storage infrastructure at significant scale.
Mean reversion: The theory that prices, valuations, or financial measures may, over time, move back toward longer-term averages.
Diversification: The allocation of investments among different assets, sectors, or strategies to reduce concentration risk; it does not guarantee a profit or protect against loss.
Disclosures
This material is provided for general informational and educational purposes only and is not intended as individualized investment advice, a recommendation, or an offer or solicitation to buy or sell any security or investment product. Readers should consider their own objectives, risk tolerance, and financial circumstances and consult appropriate financial, tax, and legal professionals.
The opinions and market commentary expressed are as of August 5, 2026, are based on information available at that time, and are subject to change without notice.
This material contains forward-looking statements, forecasts, consensus estimates, and cycle-length estimates based on assumptions and subject to significant risks and uncertainties. Actual results may differ materially, and there is no assurance that any forecast, trend, or estimate will occur.
Information obtained from third-party sources is believed to be reliable, but its accuracy, completeness, and timeliness are not guaranteed. Data are current only as of the dates cited and may be revised.
Investing involves risk, including the possible loss of principal. Technology, economic, earnings, and market trends can change or reverse unexpectedly. Diversification does not ensure a profit or protect against loss in declining markets.
References to companies, products, technologies, or third-party research are for illustrative and informational purposes only and do not constitute an endorsement or investment recommendation.
The views expressed are for informational and educational purposes only and are subject to change without notice.
This material is not intended as, and should not be interpreted as, individualized investment advice or a recommendation to buy, sell, or hold any security, sector, industry, or investment strategy.
References to specific companies, securities, sectors, or industries are for illustrative purposes only and should not be construed as investment recommendations.
Investing involves risk, including the possible loss of principal. Investments in a specific industry or sector may involve greater risk and volatility than more diversified investments.
Past performance is not indicative of future results. No investment strategy can guarantee a profit or protect against loss.
Forward-looking statements, including views about future demand, pricing, supply, or industry cycles, are based on current expectations and assumptions and are subject to risks and uncertainties. Actual results may differ materially.
Data and information are believed to be reliable, but accuracy, completeness, and timeliness are not guaranteed. Source documents should be retained for factual claims, third-party research references, and company-specific data.
Portfolio holdings, allocations, and risk budgets are subject to change based on market conditions, client objectives, and investment guidelines.
The author, firm, clients, or related persons may hold positions in securities mentioned and may buy or sell those securities without notice, subject to applicable policies and regulations.
Securities offered through LPL Financial, Member FINRA/SIPC. Investment Advice offered through WCG Wealth Advisors, LLC, an SEC Registered Investment Advisor. WCG Wealth Advisors, LLC and The Wealth Consulting Group are separate entities from LPL Financial. Index performance is shown for illustrative purposes only and does not predict or depict the performance of any investment. Past performance does not guarantee future results.
All information in this report is believed to be from reliable sources; however, WCG Wealth Advisors, LLC, makes no representation as to its completeness or accuracy.
In general, stock values fluctuate, sometimes widely, in response to activities specific to the companies as well as broad market, economic and political conditions. Stock investing involves risks, including fluctuating prices and loss of principal. Value investments can perform differently from the market as a whole. They can remain undervalued by the market for long periods of time. (135-LPL) International investing involves special risks such as currency fluctuation and political instability and may not be suitable for all investors. These risks are often heightened for investments in emerging markets. (93-LPL)
The fast price swings in commodities will result in significant volatility in an investor’s holdings. Commodities include increased risks, such as political, economic, and currency instability, and may not be suitable for all investors. (122-LPL)
Rebalancing a portfolio may cause investors to incur tax liabilities and/or transaction costs and does not assure a profit or protect against a loss. (28-LPL)
There is no guarantee that a diversified portfolio will enhance overall returns or outperform a non-diversified portfolio. Diversification does not protect against market risk. (26-LPL)
Standard deviation is a historical measure of the variability of returns relative to the average annual return. If a portfolio has a high standard deviation, its returns have been volatile. A low standard deviation indicates returns have been less volatile. (131-LPL)
This is for educational / general purposes only, does not constitute investment, tax or legal advice and should not be relied on as such. This is not to be construed as an offer to buy or sell any financial instruments. Any strategies discussed are not intended to be relied upon as the sole factor in making an investment decision for any individual. As with all investments there are associated inherent risks. Please obtain and review all financial material carefully before investing. All material presented is compiled from sources believed to be reliable and current, but accuracy cannot be guaranteed. The opinions voiced in this material are for general information only and are not intended to provide specific advice or recommendations for any individual. All performance referenced is historical and is no guarantee of future results. All indices are unmanaged and may not be invested in directly. These comments should not be construed as recommendations but as an illustration of broader themes.
Forward-looking statements are not guarantees of future results. They involve risks, uncertainties and assumptions; there can be no assurance that actual results will not differ materially from expectations. In addition, forward-looking statements, including index targets or market scenarios, are hypothetical in nature, reflect current views and assumptions and are subject to change based on market and economic conditions and are not guarantees of future performance. This is a hypothetical example and is not representative of any specific investment. Your results may vary. (88-LPL) Scenario outcomes are illustrative and not predictive. This does not constitute a recommendation of any investment strategy or product for a particular investor. Investors should consult a financial professional before making any investment decisions.
The S&P 500 is a stock market index tracking the stock performance of 500 of the largest companies listed on stock exchanges in the United States. Indexes are unmanaged and cannot be invested in directly. (102-LPL)
Government bonds and Treasury bills are guaranteed by the US government as to the timely payment of principal and interest and, if held to maturity, offer a fixed rate of return and fixed principal value.
Publication Date: August 7, 2026
For Public Use in the US
The Wealth Consulting Group
LPL 1156360