

Market Strategy
by Talley Leger, Chief Market Strategist
August 28, 2026
Consumers: Show, Don’t Tell
“Show, don’t tell” is a creative technique where a writer replaces complex, detailed explanations with sensory impressions and actions to let readers experience the story for themselves naturally. From a market strategy perspective, that means using striking visuals to “storyboard” the message because pictures are worth a thousand words. From a consumer perspective, that means people’s actions speak louder than their words. Despite historically low morale amongst households, the good news is that US consumers continue to spend (see the chart below).
How’s that possible? Cautious, doubtful and outright fearful investors should consider the positive “wealth effect” currently supporting consumption. A raging bull market compels asset owners with high-paying jobs to spend and support the top tier of the “K-shaped” economy. In other words, we’re in a positive “feedback loop” whereby asset price inflation is fueling consumption, which is brightening the earnings outlook and pushing stocks even higher.
Positive “Wealth Effect:” Actions Speak Louder Than Words
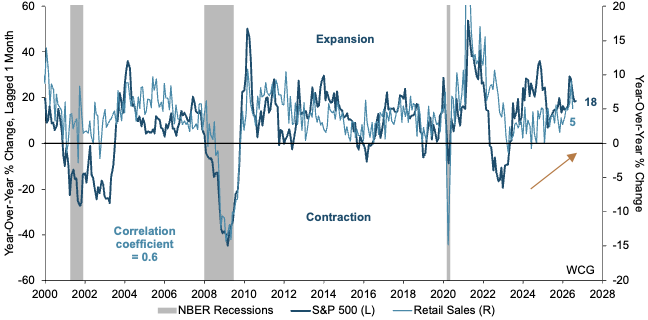
Sources: FRED, S&P Global, WCG, 08/24/26. Notes: NBER = National Bureau of Economic Research.
True, the recent sequential deceleration in retail sales partly reflects ebbing liquidity from the income tax refund and Amazon Prime Day falling in June, not July. However, positive – albeit meager – real income growth, a potential wealth tax cut from easing energy prices and the corporate tariff refund should provide important offsets / supports for consumption.
$166 Billion Catalyst
The Supreme Court’s February 2026 decision to strike down the International Emergency Economic Powers Act (IEEPA) tariffs triggered an estimated $166 billion of refunds back to US importers. That capital injection is flowing through corporate income statements and/or balance sheets, creating an additional tailwind for consumer spending power, although there’s a divergence in business strategy regarding how that capital is being deployed.
Corporate Split: Volumes vs. Margins
Fundamentally, retailers are divided on whether to use the tariff windfall to support the consumer or to appease shareholders:
- Price Cutters (Market Share Strategy):Walmart received $2.9 billion and explicitly announced it’s deploying the tariff refund to lower prices and cut consumer costs. The company executed 11,000 price rollbacks in the second quarter – particularly in groceries and general merchandise – aiming to drive traffic and capture market share from cash-strapped shoppers.
- Margin Protectors (Profitability Strategy): Conversely, other retailers are using the windfall to pad their bottom lines. For example, Target, Home Depot and Lowe’s have deployed the cash to reduce their cost of sales and boost gross margins, not to cut prices. Meanwhile, TJX utilized a portion of its refund for employee incentives and bonuses.
Winners and Losers
If Walmart’s decision to use the tariff refund to lower prices successfully drives volumes, it could force a competitive response across the industry. Specifically, a broad capitulation – where other retailers pass their refunds down to the shelf level to defend market share – could act as a disinflationary force. Effectively, this scenario would deliver a secondary stimulus supporting retail sales volumes and consumer purchasing power in the second half of the year.
Big Week for Big Retailers: Solid to Healthy Top-Line Results

Sources: Seeking Alpha, WCG, 08/24/26. Notes: T = Trillion. B = Billion.
Let the Results Speak for Themselves
2Q26 company reports paint a clear picture of a bifurcated retail landscape where the consumer remains active but highly strategic.
- Triumph of Value:Target (TGT), Walmart (WMT) and BJ’s Wholesale Club (BJ) were the standout performers. Target delivered a staggering 75.64% normalized earnings per share (EPS) beat and 100.49% year-over-year (Y/Y) EPS growth, reflecting refund-assisted margin expansion, operating leverage and management execution. BJ’s impressive 15.73% Y/Y revenue growth highlights a surge in bulk, value-driven purchasing (see the surrounding tables).
- Margin Expansion: Despite varying top-line performance, every company in the surrounding tables beat both normalized and GAAP EPS estimates. In other words, major retailers have optimized their cost structures and supply chains, allowing them to protect and grow their profitability amidst intermittent disruption and lingering uncertainty with the added benefit of the tariff refund.
- Home Improvement Divergence:Lowe’s (LOW) was the lone laggard relative to top-line expectations, as it was the only retailer that missed revenue estimates by -0.56%. Despite missing the mark, however, the company still posted 8.34% Y/Y revenue growth. By contrast, The Home Depot (HD) managed to beat its revenue target by 1.35% with 5.71% Y/Y growth. While housing market weakness is impacting the industry, Home Depot’s heavier exposure to professional contractors is likely helping the company to navigate analyst expectations better than Lowe’s reliance on do-it-yourself (DIY) shoppers.
- Discretionary Deceleration:The TJX Companies (TJX) posted respectable numbers with a slight revenue beat (0.15%) and 10.91% Y/Y normalized EPS growth. Admittedly, the deceleration in earnings growth points to a consumer that’s seeking value and discounted prices over non-essential apparel.
Big Week for Big Retailers: Across the Board Bottom-Line “Beats”

Sources: Seeking Alpha, WCG, 08/24/26. Notes: EPS = Earnings per share. GAAP = Generally Accepted Accounting Principles.
Bottom Line
- Selective Shoppers: Consumers aren’t retrenching – they’re optimizing. Spending remains healthy yet focused on necessities, groceries and clear value propositions, not big discretionary splurges.
- Small-Ticket Items: Lowe’s negative revenue guidance and lower expectations for home improvement confirm that shoppers are avoiding large, easily deferrable purchases, owing to high financing costs and slow housing turnover.
- Purchasing Power: Accelerating earnings growth among the big broadline discounters and value clubs demonstrates that households are actively trading down to stretch their dollars across elevated living costs.
Portfolio Strategy
by Jim Worden, CFA®, CMT®, CAIA®, Chief Investment Officer
August 28, 2026
Worries in Bond Land?
Have you ever wondered where things just don’t add up? Perhaps it’s my analytical brain that likes to see an equation balanced or a reconciliation of where tax dollars are actually spent. Sometimes, it may feel like we’re in a shell game that feels impossible to keep up with.

The media sometimes tries to help, but often, due to how they report, things may look even more opaque after they report it. When looking over data on our national debt, there are several different figures. They are all true, but the differences can be confusing to understand. On August 18, 2026, total public outstanding debt in our country exceeded $40 trillion for the first time1. Debt held by the public, excluding Federal Reserve Treasury holdings, was $27.7 trillion2. The Treasury General Account (TGA) was at $936 billion as of 8/19/263. Japan, the largest outside holder of U.S. Treasuries, held $1.12 trillion of our debt as of 6/30/264.
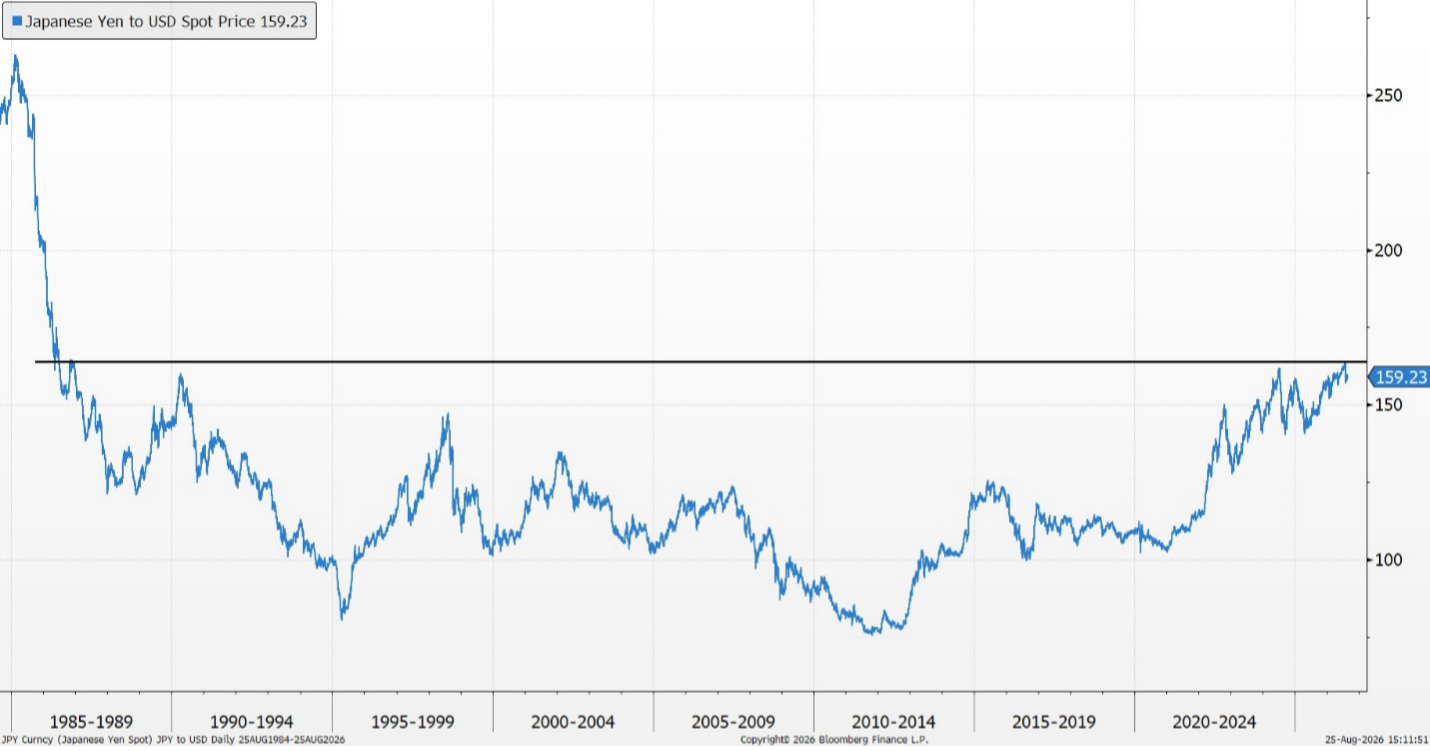
The Japanese yen per U.S. dollar was the weakest it has been in nearly 40 years5.
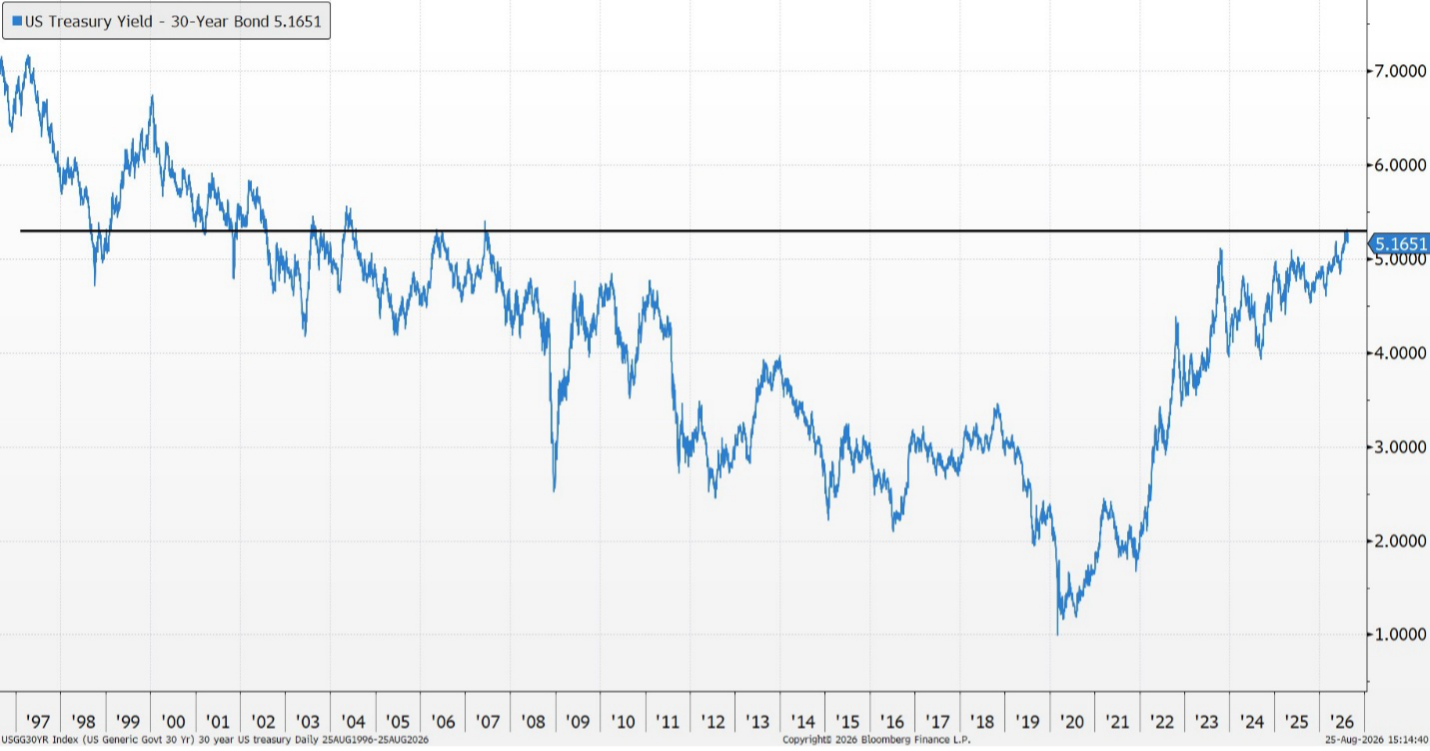
At the same time, the U.S. Treasury 30-year yield was at its highest level in more than 19 years6.
It begs the question – what exactly is going on?
On August 19, Treasury Secretary Scott Bessent made a surprise announcement that the Treasury would double the long-end buyback capacity to $4 billion per operation from $2 billion. The next day, Bessent told CNBC that Treasury could add more than $4 billion per issue, dubbing it a “Treasury Twist”7. On August 24, CNBC Senior Economics Reporter Steve Liesman wrote an article that suggested that the Treasury could tap into its TGA as part of the plan to help stabilize yields8.
And for Japan, the Federal Reserve’s FIMA Repo Facility (Foreign and International Monetary Authorities Repo Facility) allows its monetary authorities to temporarily use U.S. Treasuries as collateral to obtain dollars. Those dollars can then be sold to buy yen, helping support the currency without requiring Japan to sell its U.S. Treasuries9.
All of this can be confusing for investors as well as for professionals who try to keep up, thus the shell game analogy. We have a growing amount of debt, but some of it is owed to ourselves. Some is held by outsiders who may wish to sell it. We don’t want them to sell it, and we don’t want rates to increase. So we have some creative ways to help the Japanese and also help ourselves. After all of this effort, the yield on the 30-year U.S. Treasury is down just 17 basis points from 8/18 through 8/2510.
Adding to the confusion for investors, the Fed, which is independent of the Treasury Department, may actually raise rates next month on concerns of overheating growth, inflation, and an improving employment picture11. The Fed directly sets its short-term policy-rate target, while longer-term rates are market-determined and can also be influenced by Fed policy and balance-sheet actions. Investors are always pricing out what a short-term rate increase means for the future and for longer-term rates.
As confusing as this may all feel, we do not believe these developments, by themselves, warrant alarm for investors for the following reasons:
- We are very diversified within the fixed-income portions of the portfolios that we manage. There are many attractive opportunities for fixed income, and we don’t believe holding a significant amount of longer-duration Treasury exposure is worth the risk. If we see that the Fed and Treasury approach this with a Bazooka or “do anything to bring rates down” approach, having some exposure to longer Treasury bonds could be an opportunity. We don’t believe we’re there yet.
- We have full faith and confidence that the Federal Reserve and the Treasury would work together to ensure there is ample liquidity for investors in U.S. Treasuries. We have gone through multiple periods where the economy has been stress-tested, and each time, the Fed and Treasury have worked together to solve liquidity challenges. We believe they would do so again.
- Despite the very large amount of debt that our country has issued, we should keep this in the context of GDP, economic growth, and the U.S. dollar still being the reserve currency for the world. While the U.S. represents just 4% of the world’s population, approximately 26% of world nominal GDP comes from the U.S.12. We don’t believe this will change any time soon.
- Finally, when we look at the aggregate assets and liabilities of households and nonprofit organizations, our country has $204.5 trillion in assets and $21.6 trillion in liabilities. An aggregate net worth of $183 trillion versus debt held by the public, excluding Federal Reserve Treasury holdings, of $27.7 trillion may help us understand that the scope is not as bad as it is sometimes reported13.
Footnotes
- U.S. Department of the Treasury, FiscalData, “Debt to the Penny,” record date August 18, 2026. Total Public Debt Outstanding: approximately $40.047 trillion.
- U.S. Department of the Treasury, FiscalData, “Debt to the Penny,” August 18, 2026; Board of Governors of the Federal Reserve System, H.4.1, “Factors Affecting Reserve Balances,” August 20, 2026 (data as of August 19, 2026). Debt held by the public, excluding Federal Reserve Treasury holdings: $32.266 trillion of debt held by the public less $4.542 trillion of Federal Reserve Treasury holdings = approximately $27.724 trillion.
- Board of Governors of the Federal Reserve System, H.4.1, “Factors Affecting Reserve Balances,” August 20, 2026 (data as of August 19, 2026). U.S. Treasury General Account: $936.406 billion.
- U.S. Department of the Treasury, Treasury International Capital (TIC), Table 5, “Major Foreign Holders of Treasury Securities,” June 2026. Japan: $1,116.7 billion.
- Bloomberg, as of 8/25/26
- Bloomberg, as of 8/25/26
- U.S. Department of the Treasury, “Treasury Announces Increased Sizes of Nominal Long-End Liquidity Support Buybacks Beginning September 9,” August 19, 2026; CNBC, “U.S. Treasury Secretary Scott Bessent Speaks with CNBC’s Sara Eisen on ‘Squawk on the Street,’” August 20, 2026.
- Steve Liesman, “Bessent could tap near $1 trillion Treasury General Account to fund bond buybacks, sources said,” CNBC, August 24, 2026.
- Board of Governors of the Federal Reserve System, “FIMA Repo Facility FAQs”; Japan Ministry of Finance, “Statement by Ms. KATAYAMA Satsuki, Minister of Finance, Japan,” August 3, 2026. Japan stated that it plans to utilize the FIMA Repo Facility in the future.
- Bloomberg, 8/18/26 to 8/25/26, intraday yields
- Bloomberg, World Interest Rate Probability, 37% probability of a 0.25% interest-rate hike on 9/16/26, as of 8/25/26
- International Monetary Fund, World Economic Outlook, April 2026, IMF DataMapper, 2026 projections for GDP at current prices and population. U.S. nominal GDP of approximately $32.38 trillion represents about 26% of projected world nominal GDP; the U.S. population is approximately 4% of the world total.
- Board of Governors of the Federal Reserve System, Financial Accounts of the United States (Z.1), “Recent Developments,” June 11, 2026 (data through March 31, 2026): household and nonprofit assets approximately $204.5 trillion, liabilities approximately $21.6 trillion, and net worth $183.0 trillion. The $27.7 trillion figure is debt held by the public, excluding Federal Reserve Treasury holdings, as calculated in footnote 2.
Definitions
Basis point (bp): One one-hundredth of one percentage point. One hundred basis points equal 1.00 percentage point.
Debt held by the public: Federal debt held by investors outside federal government accounts, including individuals, institutions, foreign investors, and the Federal Reserve. Where noted in this commentary, Federal Reserve Treasury holdings are excluded from this figure.
Duration: A measure of a fixed-income security’s sensitivity to changes in interest rates. Generally, securities with longer duration experience larger price changes when interest rates move.
FIMA Repo Facility: The Federal Reserve’s Foreign and International Monetary Authorities Repo Facility, which allows approved foreign and international monetary authorities to temporarily obtain U.S. dollars against U.S. Treasury securities held in custody at the Federal Reserve.
Gross domestic product (GDP): The market value of final goods and services produced within a country during a specified period.
Treasury General Account (TGA): The U.S. Treasury Department’s primary operating account at the Federal Reserve, used to receive government receipts and make federal payments.
Treasury buyback: A transaction in which the U.S. Treasury repurchases outstanding marketable Treasury securities. Liquidity-support buybacks are intended to support market liquidity and cash-management objectives and are distinct from Federal Reserve monetary-policy purchases.
Yield / long end of the yield curve:Yield is the return implied by a bond’s price and cash flows. Bond prices and yields generally move in opposite directions. The “long end” refers to longer-maturity Treasury securities, such as 10-, 20-, and 30-year issues.
Net worth: Total assets minus total liabilities.
NBER Recession: A significant decline in economic activity spread across the economy, lasting more than a few months, as officially designated by the National Bureau of Economic Research. It is determined by analyzing factors like gross domestic product, income and employment.
S&P 500: A stock market index tracking the performance of 500 of the largest publicly traded companies in the United States. It serves as a primary benchmark for the overall health of the U.S. stock market.
Retail Sales: An economic metric that measures the total consumer spending on durable and non-durable goods over a specific period. It is tracked monthly and serves as a key indicator of consumer confidence and economic health.
Profit Margin: A profitability ratio calculated by dividing net income by total revenue to show what percentage of sales turned into profit. It measures how effectively a company converts its top-line revenue into bottom-line earnings.
Normalized EPS: An adjusted earnings per share metric that strips out one-time gains, non-recurring expenses, and seasonal fluctuations. It helps investors gauge a company’s true, ongoing operational profitability under normal conditions.
GAAP EPS: A standard earnings per share metric calculated strictly according to Generally Accepted Accounting Principles (GAAP). It represents a company’s official, legally mandated profit allocation per outstanding share of common stock.
Correlation Coefficient: A numerical measure that quantifies the strength and direction of a linear relationship between two variables. It ranges from -1 to +1, where values close to the extremes indicate a strong relationship and zero indicates no linear correlation.
Disclosures
This material is provided for informational and educational purposes only and is not intended as investment advice, a recommendation, or an offer or solicitation to buy or sell any security or investment product. Opinions and market observations are as of August 25, 2026, and are subject to change without notice.
Information and data are derived from sources believed to be reliable, including Bloomberg, the U.S. Department of the Treasury, the Board of Governors of the Federal Reserve System, the International Monetary Fund, CNBC, and Japan’s Ministry of Finance; however, their accuracy, completeness, or timeliness cannot be guaranteed.
Statements regarding future market, economic, policy, or interest-rate developments are forward-looking and reflect current expectations. Actual outcomes may differ materially, and there is no assurance that any forecast, expectation, or investment objective will be realized.
Fixed-income securities are subject to interest-rate, credit, inflation, and liquidity risk. Bond prices generally fall when interest rates rise, and longer-duration securities generally experience greater price sensitivity to changes in interest rates. U.S. Treasury securities are backed by the full faith and credit of the U.S. government as to the timely payment of principal and interest if held to maturity, but their market value may fluctuate prior to maturity.
Diversification does not ensure a profit or protect against loss. References to portfolio positioning are general in nature; actual holdings, allocations, and strategies may vary by client based on objectives, risk tolerance, restrictions, and other circumstances.
The views expressed are for informational and educational purposes only and are subject to change without notice.
This material is not intended as, and should not be interpreted as, individualized investment advice or a recommendation to buy, sell, or hold any security, sector, industry, or investment strategy.
References to specific companies, securities, sectors, or industries are for illustrative purposes only and should not be construed as investment recommendations.
Investing involves risk, including the possible loss of principal. Investments in a specific industry or sector may involve greater risk and volatility than more diversified investments.
Past performance is not indicative of future results. No investment strategy can guarantee a profit or protect against loss.
Forward-looking statements, including views about future demand, pricing, supply, or industry cycles, are based on current expectations and assumptions and are subject to risks and uncertainties. Actual results may differ materially.
Data and information are believed to be reliable, but accuracy, completeness, and timeliness are not guaranteed. Source documents should be retained for factual claims, third-party research references, and company-specific data.
Portfolio holdings, allocations, and risk budgets are subject to change based on market conditions, client objectives, and investment guidelines.
The author, firm, clients, or related persons may hold positions in securities mentioned and may buy or sell those securities without notice, subject to applicable policies and regulations.
Securities offered through LPL Financial, Member FINRA/SIPC. Investment Advice offered through WCG Wealth Advisors, LLC, an SEC Registered Investment Advisor. WCG Wealth Advisors, LLC and The Wealth Consulting Group are separate entities from LPL Financial. Index performance is shown for illustrative purposes only and does not predict or depict the performance of any investment. Past performance does not guarantee future results.
All information in this report is believed to be from reliable sources; however, WCG Wealth Advisors, LLC, makes no representation as to its completeness or accuracy.
In general, stock values fluctuate, sometimes widely, in response to activities specific to the companies as well as broad market, economic and political conditions. Stock investing involves risks, including fluctuating prices and loss of principal. Value investments can perform differently from the market as a whole. They can remain undervalued by the market for long periods of time. (135-LPL) International investing involves special risks such as currency fluctuation and political instability and may not be suitable for all investors. These risks are often heightened for investments in emerging markets. (93-LPL)
The fast price swings in commodities will result in significant volatility in an investor’s holdings. Commodities include increased risks, such as political, economic, and currency instability, and may not be suitable for all investors. (122-LPL)
Rebalancing a portfolio may cause investors to incur tax liabilities and/or transaction costs and does not assure a profit or protect against a loss. (28-LPL)
There is no guarantee that a diversified portfolio will enhance overall returns or outperform a non-diversified portfolio. Diversification does not protect against market risk. (26-LPL)
Standard deviation is a historical measure of the variability of returns relative to the average annual return. If a portfolio has a high standard deviation, its returns have been volatile. A low standard deviation indicates returns have been less volatile. (131-LPL)
This is for educational / general purposes only, does not constitute investment, tax or legal advice and should not be relied on as such. This is not to be construed as an offer to buy or sell any financial instruments. Any strategies discussed are not intended to be relied upon as the sole factor in making an investment decision for any individual. As with all investments there are associated inherent risks. Please obtain and review all financial material carefully before investing. All material presented is compiled from sources believed to be reliable and current, but accuracy cannot be guaranteed. The opinions voiced in this material are for general information only and are not intended to provide specific advice or recommendations for any individual. All performance referenced is historical and is no guarantee of future results. All indices are unmanaged and may not be invested in directly. These comments should not be construed as recommendations but as an illustration of broader themes.
Forward-looking statements are not guarantees of future results. They involve risks, uncertainties and assumptions; there can be no assurance that actual results will not differ materially from expectations. In addition, forward-looking statements, including index targets or market scenarios, are hypothetical in nature, reflect current views and assumptions and are subject to change based on market and economic conditions and are not guarantees of future performance. This is a hypothetical example and is not representative of any specific investment. Your results may vary. (88-LPL) Scenario outcomes are illustrative and not predictive. This does not constitute a recommendation of any investment strategy or product for a particular investor. Investors should consult a financial professional before making any investment decisions.
The S&P 500 is a stock market index tracking the stock performance of 500 of the largest companies listed on stock exchanges in the United States. Indexes are unmanaged and cannot be invested in directly. (102-LPL)
Government bonds and Treasury bills are guaranteed by the US government as to the timely payment of principal and interest and, if held to maturity, offer a fixed rate of return and fixed principal value.
Publication Date: August 28, 2026
For Public Use in the US
The Wealth Consulting Group
LPL 1166610